post

SAP Afaria in the Cloud – enterprise functionality, consumer pricing

Broken SmartPhone
One of the most interesting announcements which came out of SAP’s SapphireNow conference in Orlando last week was the Afaria in the Cloud update. This is a real game-changer (an expression we use very rarely) for a number of reasons.

Afaria, if you are not familiar, is SAP’s mobile device management (MDM) product. What does that mean – it means Afaria secures, monitors and manages all types of mobile devices (smartphones, tablet computers, mobile POS devices, etc.). Because mobile is making organisations far more efficient, as we’ve written previously here, more and more industries are deploying them. And thus the need for MDM solutions to protect mobile devices, to reduce risk and increase employee productivity.

Typical MDM functionality allows for over the air (OTA) updates, remote tracking and wiping in the event that the device is stolen, and sandboxing of personal and work-related mobile functionality, for example.

During the announcement at SapphireNow, one of the light-hearted potential usage scenarios mentioned was that as a reward for hitting sales targets an employee might be allowed to play Angry Birds for a set duration.

The fact that SAP are now offering this as a cloud option is significant because MDM offerings typically require a server to control the devices. There can be significant cost and time factors associated with the purchase and deployment of the MDM server. This is done away with with the cloud version. But still, this isn’t entirely game-changing, right?

No, the real game-changer came when SAP announced the price for Afaria in the cloud – €1 per device, per month. And it is possible to trial it for free for 30 days. Sitting in the announcement it occurred to us that that kind of price makes Afaria in the Cloud suddenly attractive, not just to organisations, but also to regular parents looking to keep their children’s mobile devices safe.

As far as we know, this is the first time SAP have offered a product at such a low price point for enterprise customers. This pricing is almost as if SAP were aiming it squarely at the consumer app market. I know if I had an option to safeguard my kids mobile devices for €1 per device per month, I’d grab it. In a heartbeat. Unfortunately we can’t test Afaria as the free trial registration page doesn’t include European countries in its list of available countries. Yet. Although countries like Vanuatu, Uzbekistan and even Somalia get to try it out 🙁

It seems SAP is getting very aggressive in its cloud pricing options. We’ve heard that the TwoGo ride-sharing app will be similarly priced (€1 per user, per month) when it’s official pricing is eventually published.

Cloud price wars anyone?

Disclosure – SAP paid my travel and accommodation expenses for this conference

Image credit Tom Raftery

post

Things are changing fast in medicine, thanks to mobile.

Wow – this is an amazing video on just how much smartphones can help reduce costs, increase healthcare efficiency and improve patient well-being and outcomes.

Screen Shot 2013-05-07 at 14.56.26

We may not be fully there yet in terms of the widespread availability of this hardware and software, and then there’s getting it accepted by the medical establishment, but this is certainly a big step in the right direction.

A search in the iPhone App store for the term ‘Glucose” returns 217 apps and a similar number for the term ‘ECG’, while a search for ‘Glucose” in the Google Play Android apps store returns over 1,000 results

Things are changing fast in medicine thanks to mobile – exciting times ahead.

post

SAP releases mobile app for utilities customer engagement

They say the secret to any good relationship is communication.

Most utility companies don’t seem to have received the memo though. In a lot of cases, the only time you hear from your utility company is when you receive a bill, or a disconnect notice. Neither are very positive forms of communication. It is no wonder then that utility companies generally are not held in high regard.

In an effort to help utility companies improve their communications, and connect more closely with their customers, SAP this week launched their Utilities Customer Engagement mobile app. The new mobile app is available now for download from the iTunes Store and Google Play.

SAP Utilities Customer Engagement

The app has lots of cool functionality, such as the ability to see and pay bills, check consumption and outage information and High Bill Alerts and other messages in the Message Centre, to warn customers when their bill is going to be higher than usual. This would have been very handy for PG&E to have had back in 2009 when their smart meter rollout was incorrectly blamed for customers suddenly receiving higher bills.

Facebook reported last December that the number of people accessing the site from mobile devices now exceeds access from desktop devices, and not surprisingly, this has also been true of Twitter for some time. Given that, it could be that SAP are missing a trick here. It would be very useful if in the My Profile section of the app, customers could enter their social media details (Twitter account, Facebook, Google+ etc.), then the app could send them messages and alerts to their social network of choice, rather than customers having to log into the app to see alerts.

This is a fundamental tenet of good communications – talk to the customer on their platform of choice, don’t force them to come to you. Perhaps in version 2.0.

Of course, this mobile app will only be any good, if SAP can persuade their utility customers to deploy it – whether they can pull that off remains to be seen (but, I know I’d want my utility company to roll it out!).

Image credit Lady Madonna

post

SAP TwoGo – ride-sharing software for the enterprise

In a less than obvious move earlier this week, SAP launched a ride-sharing app called TwoGo.

Why less than obvious? Well, ride-sharing is generally perceived as more of a consumer focused activity, than an enterprise one. And SAP is very much an Enterprise software company.

iPhone Rideshare apps

A quick search for ride-share iPhone apps, for example returns 24 results, all of which are consumer software plays.

TwoGo is more than just a smartphone app though (it is available on most mobile platforms), TwoGo customers can also access it through its website, via email, via any iCal enabled calendar application, and even via SMS.

It is a single instance, multi-tenant cloud application. This is important because it means for any organisations deploying TwoGo, set-up on SAP’s side simply involves adding the organisations email domain to the customer table. Then employees are immediately enabled to create a TwoGo account by signing up with their work email address.

Also, because it is single-instance and multi-tenant, smaller companies can sign up and benefit from sharing rides with employees of other companies in the area who are also TwoGo subscribers.

And because TwoGo works with email, and iCal already, integration issues are minimal.

Why would an organisation want to deploy a ride-sharing app, you ask?
There are several good reasons –

  • if companies are subsidising travel for employees, ride-sharing reduces the number of trips taken by employees, thereby contributing directly to the organisation’s bottom line.
  • For organisations with vehicle fleets, this also reduces wear and tear, service and maintenance costs for vehicles.
  • Then there’s the issue of having to provide car parking spaces for employees – this is expensive and a poor use of the space. Reducing the number of cars coming to work, de-facto reduces the amount of car parking spaces an organisation needs to provide.
  • And, obviously, ride-sharing will also reduce the organisation’s greenhouse gas emissions.

Then there’s the more intangible benefits –

  • Employees spending more time together leads to serendipitous meetings – what was previously ‘dead time’ in the car can now be productive
  • And it brings employees closer to each other and to the company

What about employees though – what benefits can they get from ride-sharing?
Carpool lane sign

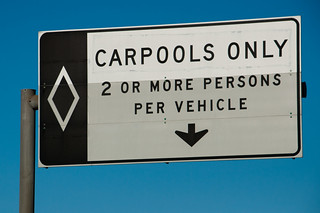
  • The obvious one is the ability to use carpool lanes on freeways where traffic often moves significantly faster
  • Also, according to the US Census Bureau, nearly 600,000 Americans have “mega-commutes” of at least 90 minutes and 50 miles each way to work. A significant number of those would benefit from ride-sharing because of reduced costs (fuel and automobile wear and tear) and also to share the driving load. Driving, especially in heavy traffic, is frustrating.
  • Then there’s the social benefits of meeting new people, making new friends and learning more about other job functions in your organisation.

TwoGo, although just now being released, has been in operation at SAP for 2 years now. It is at release number 4.5, so this is already a mature product. SAP themselves report that TwoGo has generated more than $5 million in value, reduced greenhouse gas emissions by eliminating 400,000 miles of driving, and matched employees into carpools more than 36,000 times, creating 2,200 additional days of networking time among employees.

The app is highly configurable and has clever algorithms which only offer a user a ride to work, if it can also offer him/her a ride home that evening, as well. And obviously, the app has block lists to ensure you are not repeatedly offered lifts with someone you’d rather avoid.

Given all the benefits of TwoGo, we have to wonder why other enterprise software vendors haven’t come up with a similar product before now. Or have they? Does TwoGo have an enterprise competitor we’re not aware of?

Carpool lane image credit Lady Madonna

post

Mobile, the utility industries and beyond

SmartPhone

It is hard to over-state the huge advances mobile devices have brought to companies in the last two years. We’ve featured a few examples here on GreenMonk in the past.

I was at the SAP for Utilities event in Copenhagen last week to moderate a panel and while there I happened to sit in on Rory Shaffer‘s talk on how mobile is impacting utility organisations, and it has been equally transformative there too!

Rory tells stories of how mobile apps and devices are helping the field work force reduce safety incidents, improve work quality, and shorten work cycles. For managers and executives, it allows them to see at their fingertips how their assets are performing, check customer trends and financial and regulatory exposure. Customers are also seeing new leaps forward in how they interact with their utilities thanks to mobile. Texas company CenterPoint Energy have a Mobile Outage Tracker app, for example available on both the Android and iOS platforms.

We are seeing a rise in the number of utilities with mobile portals for customers, faster resolution of issues thanks to mobile, and utilities starting to respond to their customers on the customers’ channels of choice (often Twitter or Facebook on customers’ mobile devices).

Rory cited some impressive outcomes from the rollout of mobile solutions by Pacific Gas and Electric. Their field worker productivity rose by 47% after the deployment because the new mobile solutions reduced their paper based workflow from twelve steps to five. Other advantages encountered included an increase in the average number of monthly work orders per employee from 43 to 87, substation inspection time reduced 80% from 2.5 hours to 20 minutes and reduced data entry time by an average 30 minutes per day.

Reductions in the number of steps by substituting with mobile also yields advantages like fewer data input errors, reduced paper use, and increased transparency across the organisation.

Most of these advantages achieved from the rollout of mobile applications are not unique to the utility industry, but are applicable to most industries across the board (particularly those with field service staff, it has to be said). The story of how mobile is changing enterprise is just starting out and if the efficiency gains of the last 24 months are any indication, we are in for exciting times ahead.

Image credit Tom Raftery

post

Facebook and ebay’s data centers are now vastly more transparent

ebay's digital service efficiency

Facebook announced at the end of last week new way to report PUE and WUE for its datacenters.

This comes hot on the heels of ebay’s announcement of its Digital Service Efficiency dashboard – a single-screen reporting the cost, performance and environmental impact of customer buy and sell transactions on ebay.

These dashboards are a big step forward in terms of making data centers more transparent about the resources they are consuming. And about the efficiency, or otherwise, of the data centers.

Even better, both organisations are going about making their dashboards a standard, thus making their data centers cross comparable with other organisations using the same dashboard.

Facebook Prineville Data Center dashboard

There are a number of important differences between the two dashboards, however.

To start with, Facebook’s data is in near-realtime (updated every minute, with a 2.5 hour delay in the data), whereas ebay’s data is updated every quarter of a year. So, ebay’s data is nowhere near realtime.

Facebook also includes environmental data (external temperature and humidity), as well as options to review the PUE, WUE, humidity and temperature data for the last 7 days, the last 30 days, the last 90 days and the last year.

On the other hand, ebay’s dashboard is, perhaps unsurprisingly, more business focussed giving metrics like revenue per user ($54), the number of transactions per kWh (45,914), the number of active users (112.3 million), etc. Facebook makes no mention anywhere of its revenue data, user data nor its transactions per kWh.

ebay pulls ahead on the environmental front because it reports its Carbon Usage Effeftiveness (CUE) in its dashboard, whereas Facebook completely ignores this vital metric. As we’ve said here before, CUE is a far better metric for measuring how green your data center is.

Facebook does get some points for reporting its carbon footprint elsewhere, but not for these data centers. This was obviously decided at some point in the design of its dashboards, and one has to wonder why.

The last big difference between the two is in how they are trying to get their dashboards more widely used. Facebook say they will submit the code for theirs to the Opencompute repository on Github. ebay, on the other hand, launched theirs at the Green Grid Forum 2013 in Santa Clara. They also published a PDF solution paper, which is a handy backgrounder, but nothing like the equivalent of dropping your code into Github.

The two companies could learn a lot from each other on how to improve their current dashboard implementations, but more importantly, so could the rest of the industry.

What are IBM, SAP, Amazon, and the other cloud providers doing to provide these kinds of dashboards for their users? GreenQloud has had this for their users for ages, now Facebook and ebay have zoomed past them too. When Facebook contributes oits codebase to Github, then the cloud companies will have one less excuse.

Image credit nicadlr

post

Microsoft, big data and smarter buildings

Smarter building dashboard

If you checked out the New York Times Snow Fall site (the story of the Avalanche at Tunnel Creek), then Microsoft’s new 88 Acres site will look familiar. If you haven’t seen the Snow Fall site then go check it out, it is a beautiful and sensitive telling of a tragic story. You won’t regret the few minutes you spend viewing it.

Microsoft’s 88 Acres is an obvious homage to that site, except that it tells a good news story, thankfully, and tells it well. It is the story of how Microsoft is turning its 125-building Redmond HQ into a smart corporate campus.

Microsoft’s campus had been built over several decades with little thought given to integrating the building management systems there. When Darrell Smith, Microsoft’s director of facilities and energy joined the company in 2008, he priced a ‘rip and replace’ option to get the disparate systems talking to each other but when it came in at in excess of $60m, he decided they needed to brew their own. And that’s just what they did.

Using Microsoft’s own software they built a system capable of taking in the data from the over 30,000 sensors throughout the campus and detecting and reporting on anomalies. They first piloted the solution on 13 buildings on the campus and as they explain on the 88 Acres site:

In one building garage, exhaust fans had been mistakenly left on for a year (to the tune of $66,000 of wasted energy). Within moments of coming online, the smart buildings solution sniffed out this fault and the problem was corrected.
In another building, the software informed engineers about a pressurization issue in a chilled water system. The problem took less than five minutes to fix, resulting in $12,000 of savings each year.
Those fixes were just the beginning.

The system balances factors like the cost of a fix, the money that will be saved by the fix, and the disruption a fix will have on employees. It then prioritises the issues it finds based on these factors.

Microsoft facilities engineer Jonathan Grove sums up how the new system changes his job “I used to spend 70 percent of my time gathering and compiling data and only about 30 percent of my time doing engineering,” Grove says. “Our smart buildings work serves up data for me in easily consumable formats, so now I get to spend 95 percent of my time doing engineering, which is great.”

The facilities team are now dealing with enormous quantities of data. According to Microsoft, the 125 buildings contain 2,000,000 data points outputting around 500,000,000 data transactions every 24 hours. The charts, graphics and reports it produces leads to about 32,300 work orders being issued per quarter. And 48% of the faults found are corrected within 60 seconds. Microsoft forecasts energy savings of 6-10% per year, with an implementation payback of 18 months.

Because Microsoft’s smart building tool was built using off the shelf Microsoft technologies, it is now being productised and will be offered for sale. It joins a slew of other smarter building solutions currently on the market from the likes of IBM, Echelon, Cisco et al, but given this one is built with basic Microsoft technologies, it will be interesting to see where it comes in terms of pricing.

Price will certainly be one of the big deciding factors in any purchasing decision, any building management tool will need to repay it’s costs within at least 18 months to merit consideration. Functionality too will be one of the primary purchase filters and what is not clear at all, from the Microsoft report, is whether their solution can handle buildings on multiple sites or geographies. If I hear back either way from Microsoft on this, I will update this post.

This is a market that is really starting to take off. Navigant Research (formerly Pike Research) issued a report last year estimating the size of the smart building managed services market alone will grow from $291m in 2012 to $1.1bn by 2020. While IMS Research estimated the Americas market for integrated and intelligent building systems was be worth more than $24 billion in 2012.

One thing is for sure, given that buildings consume around 40% of our energy, any new entrant into the smarter buildings arena is to be welcomed.

Image credit nicadlr

post

Social media and utility companies

I’m moderating a panel discussion on social media and utilities at next week’s SAP for Utilities event in Copenhagen. My fellow panelists will include two representatives from utility companies, and one from SAP.

This is not new ground for me, I have given the closing keynotes at the SAP for Utilities in San Antonio in 2011 and the SAP for Utilities event in Singapore in 2012, both times on this topic.

In my previous talks on this topic I start out talking about how utilities have started to use social media for next generation customer service – this is an obvious use case and there are several great examples of utilities doing just this.

However, there are also other very compelling use cases for social in utilities. In the US over one third of the workforce is already over 50 years old, and according to the US Bureau of Labor Statistics 30-40% of the workforce will retire in the next 10 years. This is not confined to the US and so recruitment and retention are topics of growing concern for utilities.

Now, utilities are rarely seen by young graduates as a ‘cool’ place to work. But this can change. Remember a couple of years back when Old Spice was the cologne your grandad might wear? Old Spice rolled out a social media campaign with a superb series of YouTube ads (the first of which has been viewed 45 million times). In the month which followed their sales went up 100%, and a year later their sales were still up 50%.

Videos like the one above produced by Ausgrid, while not about to rival Old Spice for viewership, do show a more human and appealing side of the company to any potential employees.

Rotary dial phone

Also, when I ask utility companies whether they allow employees to access social media from their work computers, the majority of times the answer is no, or limited. Even if only from the perspective of retaining good employees, this has to change. Today’s millennials are far more likely to use social media as a way to network and find information online (see chapter four of this three year old Pew Research study on Millennials [PDF] for more on this). Blocking access to social media sites, especially for younger employees, is analogous to putting a rotary dial phone on their desk, with a padlock on the dial. Don’t just take my word for it. Casey Coleman, the CIO of the U.S. General Services Administration said recently:

Twitter is a primary source to gather information about changes in my industry. It helps the organization stay current with the latest trends and thinking.

Blocking employees access to social media stifles them from doing their job effectively, and any employee who feels that s/he is not being allowed to do their job properly won’t be long about looking for a new one.

Social media can also be used internally as a means of retaining knowledge from retiring workers, and as a way of making employees more productive using internal social collaboration tools (Jam, Huddle, Chatter, etc.).

Finally, as I’ve mentioned before, with the rise of mobile usage of social media, there is now the ability to tap into social media’s big data firehose in realtime to improve on outage management.

There are bound to be more uses of social media (real or potential) that I’m missing – if you can think of any, please leave a comment on this post letting us all here know.

Also, the panel discussion is on next Friday April 19th at 3pm CET – we’ll be watching the Twitter hashtag #SocialUtils. If you have any questions/suggestions to put to the panel, leave them there and we’ll do our best to get to them.

post

Public transportation, smartphones and economic development – a winning combination for Miami-Dade

It is hard to make public transport interesting, but Miami-Dade Transit in Florida is certainly giving it a go!

Their Metromover automated people mover is the most successful downtown people mover in the United States, and it is free!

Their Metrorail and some of their Metrobus services have on-board wifi (based on cellular service), and it is free.

They have smartphone Transit Tracker apps for iOS and Android devices allowing passengers to get realtime information on arrival times, station information and trip planning.

And they plan to make more improvements still. One of the ideas I particularly liked is outlined by Carmen Suarez, an Enterprise Architect with Miami-Dade Enterprise Technology Services Department at 01:30 in the video above.

The idea is to send push notifications to the smartphones of people who have the Transit Tracker app on their phone. The notifications would advise people of special offers/discounts from local businesses near their destination. It sounds simple enough, but as Carmen points out in the video it gives people yet another reason to use public transport, it helps reduce traffic congestion, and it promotes economic development in those areas. Win, win, win.

What cool public transport and smartphone-related stories have you come across?

post

SAP releases its Integrated Report 2012 – an integrated financial and sustainability report

SAP released their first Sustainability report in 2008 (their 2007/2008 report). Like the reports of most other companies at the time, it was released as a PDF document but SAP quickly shifted gears. SAP’s 2008 Sustainability report, was released as a website. This had the dual purpose of making the site more accessible, and also allowing SAP to see which areas of the site had more traction. The following year they made their report more social and every year since they have added something new.

As well as releasing its Sustainability reports each year, SAP also published its annual financial reports. This year, for the first time, SAP have integrated the two reports and they have just published their SAP Integrated Report 2012. It takes the form of a highly interactive website with built-in analytics and downloadable PDF’s.

This was an idea GreenMonk first mooted when I asked SAP’s Chief Sustainability Officer Peter Graf in a 2011 interview whether SAP had any plans to integrate the two documents.

On a conference call at the launch of the integrated report, SAP Chief Accounting Officer Christoph Hütten went to great pains to stress that this wasn’t merely the content of both reports in one, but that the content was very tightly bound together. The report demonstrates how connections and inter-dependencies between financial and non-financial performance impact each other, he said.

The document/website contains all the financial and sustainability-related information you would expect to find in reports of this type. And the report also has a nice page showcasing and explaining the connections between the financial and non-financial performance.

Other nice features of the report are an integrated tweetstream showcasing mentions of the #sapintegrated hashtag on some pages, an option to make notes on pages (with the ability to download those pages as PDF’s subsequently), and the download centre for downloading the annotated pages, as well as financial statements, graphics and other reports.

For the first time also, SAP are releasing their 2012 sustainability information in XBRL format (.zip file) – something GreenMonk also suggested to SAP back in 2011. If you are unfamiliar with XBRL, it is an XML-based global standard for exchanging business information.

Impressive as well was the fact that at the end of the conference call launching the report, Peter Graf mentioned that SAP are actively looking to co-innovate. He asked that anyone, be they in the financial or sustainability reporting space, who is interested in integrated reporting get in touch with him to work together to bring integrated reporting to everyone “at the lowest possible cost and highest possible precision”.

The video above is a demo of the report and I have placed a transcript of the video here.