post

Apple launches ResearchKit – secure, private, open source medical research

ResearchKit

Apple announced a new initiative at its Spring Forward event yesterday – ResearchKit.

What is ResearchKit? Apple’s SVP of Operations, Jeff Williams, described it as a framework for medical researchers to create and deploy mobile apps which collect and share medical data from phone users (with their permission), and share it with the researchers.

Why is this important? Previously it has proven difficult for research organisations to secure volunteers for research studies, and the data collected from such studies is often collected, at best, quarterly.

With this program, Apple hopes to help researchers more easily attract volunteers, and collect their information far more frequently (up to once a second), yielding far richer data.

The platform itself launches next month, but already there are 5 apps available, targeting Parkinson’s, diabetes, heart disease, asthma, and breast cancer. These apps have been developed by medical research organisations, in conjunction with Apple.

The success of this approach can be seen already in this tweet:

I downloaded mPower, the app for Parkinson’s to try it out, but for now, they are only signing up people who are based in the US.

As well as capturing data for the researchers, mPower also presents valuable information to the user, tracking gait and tremor, and seeing if they improve over time, when combined with increased exercise. So the app is a win both for the research organisations, and for the users too.

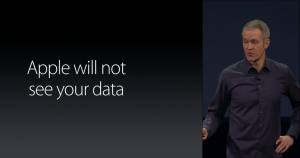
Apple Does Not See Your Data

Apple went to great pains to stress that the user is in complete control over who gets to see the data. And Apple themselves doesn’t ever get to see your data.

This is obviously a direct shot at Google, and its advertising platform’s need to see your data. Expect to hear this mantra repeated more and more by Apple in future launches.

This focus on privacy, along with Apple’s aggressive stance on fixing security holes, and defaulting to encryption on its devices, is becoming a clear differentiator between Apple and Android (and let’s face it, in mobile, this is a two horse race, for now).

ResearchKit Open Source

Finally, Williams concluded the launch by saying Apple wants ResearchKit on as many devices as possible. Consequently, Apple are going to make ResearchKit open source. It remains to see which open source license they will opt for.

But, open sourcing ResearckKit is a very important step, as it lends transparency to the privacy and security which Apple say is built-in, as well as validating Apple’s claim that they don’t see your data.

And it also opens ResearchKit up to other mobile platforms to use (Android, Windows, Blackberry), vastly increasing the potential pool of participants for medical research.

We have documented here on GreenMonk numerous times how Big Data, and analysis tools are revolutionising health care.

Now we are seeing mobile getting in on the action too. And how.

post

Technology for Good – episode thirty six with Esteban Kolsky

Welcome to episode thirty six of the Technology for Good hangout. In this week’s show our guest is independent analyst Enterprise Irregulars, but this was the first time Esteban and I had had a face-to-face conversation (or screen-to-screen, more accurately!).

The change of clocks in Europe the weekend before the show almost derailed us, and there was a mix-up (my fault) whereby Esteban didn’t get to join the show until twenty minutes in, but still, it was a great show and we had some awesome discussions.

Some of the more fascinating stories we looked at on the show, included some major moves on the energy storage front, big announcements from Google and Microsoft on the health/fitness front, and the new partnership between Twitter and IBM.

Here is the full list of stories that we covered in this week’s show:


Climate

Energy

Health

Transparency

Social

Apps

Hardware

Wearables

Comms

post

Ariba’s AribaLive conference reviewed

AribaLive 2013

I attended the AribaLive event in Berlin last week – this is the European conference for Ariba customers and partners to share stories, network and learn from one another.

Ariba is a company which provides electronic sales and procurement solutions for companies. There are over 1 million companies in 190 countries using Ariba. Customer companies mentioned or presenting included Clariant, Solvay, Disney, Deutsche Bank, Astra Zeneca, Fujitsu, Aviva and EADS. Naturally I was curious to hear how their customers fared from dematerialising parts of their buying and selling processes.

I wasn’t totally clear on some of the advantages the Ariba offers buyers and sellers until Ariba President Kevin Costello, in his keynote explained it with a good analogy to the likes of Facebook, Amazon and eBay. As Costello said, Facebook has completely changed how people connect/reconnect. Similarly, eBay and Amazon have totally transformed how people shop for goods. I knew exactly what he meant as I’ve recently bought a new camera. I started by checking camera review sites and Amazon reviews to find the best camera for my needs. I then went to both eBay and Amazon to identify the best deal, from the most reputable seller. Being able to see peer reviews not just of the camera, but of the sellers as well, meant I was very confident when I decided to buy my secondhand camera, that I would get a good product at a good price.

In the same way, Costello said, the Ariba Network brings huge transparency to enterprise buyers and sellers, allowing them to make purchasing, or sales decisions more efficiently and with fewer concerns. In fact, the consumerisation of business commerce was a term used throughout the event.

Several customer presentations followed with organisations like Spanish building company FCC mentioning that they both source €2 billion, and cut 80,000 electronic invoices with their Ariba system annually. They estimate they are saving 10% per annum by using Ariba.

Apart from the efficiencies of using electronic solutions, how else does one benefit (to the tune of 10%, for example) by using Ariba?

invoice

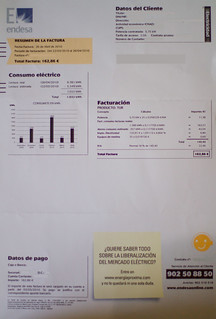
Well part of the answer was provided in the talk given by EADS Vice President of Accounts Payable, Bob McCartney. He talked about the cost of dealing with incoming invoices for EADS. According to McCartney, dealing with an invoice manually costs EADS €15, running it through OCR brings the price down to €4 per invoice, while the price of dealing with e-invoices is €2. That is massive – electronic invoicing is half the cost of OCR’d invoices and seven and a half times cheaper than manual invoices. Right there you see a huge business case for e-invoicing.

Other advantages of electronic invoicing outlined by McCartney were – a recurring 22% cost saving, increasing on-time payment of suppliers, improved visibility/forecasting of the company’s cash position, and improved relations with suppliers (more process transparency, as well as on-time payments).

Finally, Ariba’s Supplier Risk Management solution was interesting to learn about as well. This solution allows users to, for example, figure out in the event of a natural disaster in a distant part of the world, what the potential impact may on your organisations supply chain. Though a more interesting use case, given it can drill down several layers into your supply chain may be avoiding the use of conflict minerals in your products, for example.

Full disclosure – Ariba paid my travel and accommodation to attend this event.

post

Mobile, the utility industries and beyond

SmartPhone

It is hard to over-state the huge advances mobile devices have brought to companies in the last two years. We’ve featured a few examples here on GreenMonk in the past.

I was at the SAP for Utilities event in Copenhagen last week to moderate a panel and while there I happened to sit in on Rory Shaffer‘s talk on how mobile is impacting utility organisations, and it has been equally transformative there too!

Rory tells stories of how mobile apps and devices are helping the field work force reduce safety incidents, improve work quality, and shorten work cycles. For managers and executives, it allows them to see at their fingertips how their assets are performing, check customer trends and financial and regulatory exposure. Customers are also seeing new leaps forward in how they interact with their utilities thanks to mobile. Texas company CenterPoint Energy have a Mobile Outage Tracker app, for example available on both the Android and iOS platforms.

We are seeing a rise in the number of utilities with mobile portals for customers, faster resolution of issues thanks to mobile, and utilities starting to respond to their customers on the customers’ channels of choice (often Twitter or Facebook on customers’ mobile devices).

Rory cited some impressive outcomes from the rollout of mobile solutions by Pacific Gas and Electric. Their field worker productivity rose by 47% after the deployment because the new mobile solutions reduced their paper based workflow from twelve steps to five. Other advantages encountered included an increase in the average number of monthly work orders per employee from 43 to 87, substation inspection time reduced 80% from 2.5 hours to 20 minutes and reduced data entry time by an average 30 minutes per day.

Reductions in the number of steps by substituting with mobile also yields advantages like fewer data input errors, reduced paper use, and increased transparency across the organisation.

Most of these advantages achieved from the rollout of mobile applications are not unique to the utility industry, but are applicable to most industries across the board (particularly those with field service staff, it has to be said). The story of how mobile is changing enterprise is just starting out and if the efficiency gains of the last 24 months are any indication, we are in for exciting times ahead.

Image credit Tom Raftery

post

Do you want to influence EU policy on green cloud computing?

Cloud

European policymakers are reaching out to ask European citizens for their help in crafting legislation for the better of all its citizens. This is a nice departure from the lobbytocracy which exists in some countries.

Currently, as part of the Digital Agenda for Europe, there is a process in place called the Digital Agenda Assembly which has a call for discussion and feedback on a number of hot IT issues such as Cloud, Data, Security, and Social Media.

Anyone can sign up at the site and contribute.

Via Paul Miller I came across a discussion on Green Cloud, which regular readers here will recognise as an issue I have an interest in.

The Cloud group moderator posted the following question:

The recent report by Greanpeace [sic] (http://www.greenpeace.org/international/Global/international/publications/climate/2012/iCoal/HowCleanisYourCloud.pdf) cast a light on importance of energy efficiency and use of renewable energy sources for cloud environments and data centers.

Should policy address such issues in future EU cloud strategy and how ensure a green and sustainable cloud development?

Your ideas on this subject are more than welcome.

Wow – an opportunity to influence EU policy and possibly make cloud computing more Green – I couldn’t resist. I posted the following response:

Greenpeace are correct – data centers are using dirty power to run their clouds.

Unfortunately this is often outside their control – especially in the US where the utility companies are regional monopolies and there is no choice in energy provider.

In the EU, there is more competition, and data centers should be encouraged to use energy from renewable sources and to site new builds where renewables are available. The greater the demand for renewable energy, the more will be built out.

I think the best way to encourage this is through transparency. Data centres need to be required to report fully and regularly their complete energy and emissions.

Iceland is currently running one of the world’s most reliable energy grids (it doesn’t have any outages). As well as being highly reliable, it has the cheapest energy in the western world and it is 100% renewable.

Iceland is due to become a full member of the EU in the coming year – so that should help the EU in attracting cloud providers looking for a renewable energy source.

But that is quite a local solution.

The real requirement is to move our all energy generation away from fossil fuels as soon as possible – this is important not just for cloud computing, but for every aspect of our life.

As Paul says above, mandating data centres to use Green power is not an answer, moving our generation to renewables (and requiring full transparency and reporting from data centres) is.

So there you have it – my recipe for making Cloud computing Green is to require full (auditable) reporting from all data centres (and every significant energy consumer, why stop at data centres?) of the entirety of their energy and emissions. This will create a significant demand for more renewable energy, leading the generators to re-double their efforts to bring more renewables resources on-line and rewarding those who have already done so.

So if you want to influence EU policy on cloud computing to make it more Green, why not head over to the Green Cloud discussion at the Digital Agenda and let your voice be heard too?

Photo Credit supertin

post

SAP’s latest Sustainability Report is teh awesome!

SAP's 2009 Sustainability Report using OAuth!

SAP released its 2009 Sustainability Report during the week and if last years Sustainability Report was good, this one is outta the park!

SAP released their first Sustainability Report in November 08 reporting on the 2007 year. It was a good initial effort (prepared in accordance with the GRI guidelines and achieving a ?C? level certification) delivered in your typical PDF format. The main innovation the first year was that there was a separate site for readers to leave feedback.

Then in May 2009 SAP released their 2008 Sustainability Report. This report achieved a B+ GRI rating and was far more interactive than the previous report (or any Sustainability Report I had previously seen). It allowed readers to interact with the data and showcased the interactive Sustainability Map which categorised core business processes related to sustainability and mapped them into distinct categories. Again SAP solicited feedback from users.

Now the 2009 Sustainability Report takes this to the next level. It:

  • achieved an A+ GRI rating by reporting on more sustainability GRI indicators and by adding new metrics, including Renewable Energy, Business Health and Culture Index, and Employee Satisfaction
  • includes the new edition of the Sustainability Map
  • establishes short- and long-term goals for many of SAPs metrics beyond carbon footprint
  • contains more embedded interactive dashboards leveraging data sourced from SAP Carbon Impact and SAP Business Objects Sustainability Performance Management
  • enables readers to comment on SAPs performance and solutions in the context of the report (no longer on a separate site) and
  • SAP will now produce quarterly updates on their carbon performance

There’s also the Materiality Matrix and the Create Your Own sections where you can try out different scenarios to see how they would affect SAP’s goals.

What do I love about this report?

  • I love how the two co-CEO’s went beyond simply putting their name to a letter at the start of the report (that’s so 2009!). They took the time out to record videos to introduce the Sustainability Report and talking about SAP’s commitment to sustainability.
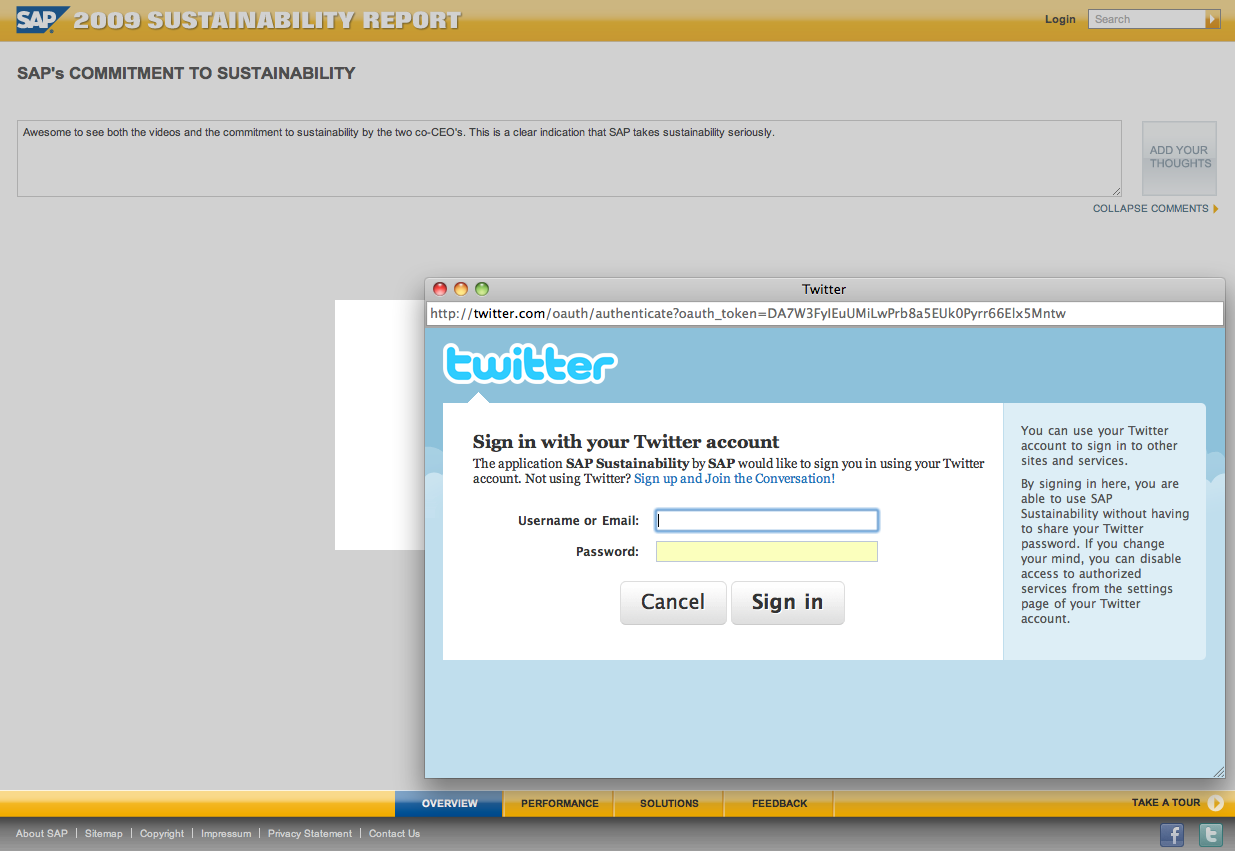
  • I love the ability to leave comments on every page. The comment system allows you to login using your Twitter, LinkedIn, Yahoo, FaceBook, Google, or AOL credentials and uses OAuth for account verification. The geek in me just loves that (hence the screenshot above).
  • I love how the performance summary presents the data in stunningly simple to digest format. Clicking on the data here drills down into more detail on those numbers. The detail section is often highly interactive. For example in the carbon footprint section of the report you can see the carbon footprint by quantity, or by employee, by region or overall, by emission scope and clicking on a year gives a breakdown for that year specifically. Also, clicking on the printer icon allows you to print, while clicking on the Excel icon lets you download the data! and
  • I love how this report makes SAP’s sustainability data and their targets so transparent

Scott Bolick, SAP’s VP Sustainability Solutions, informed me that readership of SAP’s Sustainability report went from 3,500 for the 2007 PDF report to approx 30,000 readers for the online 2008 report. On top of that, many of SAP’s customers after looking at it, asked if they could purchase the technology to produce a similar report themselves! That’s a ringing endorsement right there.

It will be interesting to see what the readership of this report will be – you gotta suspect it will blow way past the 30,000 that last year’s report had.

[Disclosure – SAP are GreenMonk clients]