post

Technology for Good – episode twenty two with David Terrar

Welcome to episode twenty two of the Technology for Good hangout. In this week’s episode we had CEO of D2C, co-founder of AgileElephant, and fellow Enterprise Irregular, David Terrar as guest on the show. As well as being a fellow Enterprise Irregular, David is an old friend, so we had a lot of fun discussing this week’s crop of stories. Last week Google held its I/O developer conference so there were plenty of Google stories breaking, but we also found time to fit in topics such as renewables, communications, and health.

Here are the stories that we discussed in this week’s show:

Climate

Renewables

Communications

Mobile

Google (!)

Wearables

Transportation

Health

post

People as Sensors – mining social media for meaningful information

I gave a talk at our recent ThingMonk, Internet of Things conference in London which I titled People as Sensors – mining Social Media for Good. The talk was principally about the many use cases where the firehose that is social media can now be analysed in realtime, and real, meaningful information can be extracted from it.

Feedback on the talk was extremely positive, so I said I’d post the video here.

Here’s the transcript of my talk:

Thanks very much! People As Sensors, it’s the idea of mining social media for useful information.

Obviously we have heard about the difference between data and information this morning, so we are just going to power through a little bit about that.

This slide deck is already up on SlideShare, so anyone wants to have a look at it, it’s there. I have my notes published, my notes for the slides published with the slides on SlideShare, so if you want to download it, you will get the notes there as well.

So mobile data; every one of us has got one of these little devices, and it’s publishing, not just the information that we publish ourselves, but also a lot of other information as well.

And this was brought home to us in 2009 very clearly when a german politician called Malte Spitz sued Deutsche Telecom because of the data retention laws in Germany that had just been legislated and he asked them for his data, he wanted the six months of data that they had on retention for him.

Can I get a show of hands here for anyone who has not heard the story already? Okay, a good few people haven’t.

So I will just break out of the presentation for a second, because — if I can; apparently it doesn’t want to. Okay, I will just — no, it doesn’t want to. What he did was he published the information in ZEIT ONLINE, and the link is at the bottom there, and all these screens that I have, all these slides that I have, they have a link at the bottom, it’s a clickable link; it’s a clickable link in the PDF on the SlideShare as well, so you can go and you can view this data.

There is a Play bottom in the bottom left there. You can hit Play on that button on the site and you can go through the six months of his life and it plays where he goes.

So when he gets on the train, the little dot there moves along the map, so you can see where he was for almost all the time of that six months. It lights up a little mobile phone icon when he is on the phone, when he is making a phone call or sending texts.

You can see where he sleeps, you can see when he sleeps, you can see when he gets up, it’s all there, and it’s all beautifully visualized. And when you see something as stark as that you suddenly realize, Jesus, we are really publishing a lot of information, aren’t we?

And it’s not just that kind of information; we are publishing a load of stuff in social medial as well. So you just take a quick look at some of the numbers in social media and you realize how big it is. Facebook have announced now that they have got 1.2 billion users and the latest numbers that they published in August, they talk about 4.5 billion likes per month, 4.75 billion items published — oh no, that’s per day. 4.5 billion likes per day, 4.75 billion items published per day, and I have forgotten how many billion photographs. It’s just insane.

Twitter, this is a typical diurnal graph of Twitter tweets per second. So you are starting at kind of midnight on the left, you are going across through the morning. It peaks at around — okay, over there it peaks at around 8,000, a little over 8,000, dips again mid-afternoon, picks up, and then drops off at nighttime. That’s daily.

The average number of tweets they say it’s around 6,000 tweets per second, and this is tweets per day over a 365 day period. You can see 400,000 going up to around 600,000 tweets per day now.

And Twitter are actually selling this data. They announced in their filing for the IPO that they have made about 47.5 million, which is quite modest I would have thought, selling direct access to their data. So people who buy their data from them house their servers in the same complex as the Twitter servers and get direct access to all the tweets that have been published instantaneously so they can mine it there and then.

So it’s not just Twitter, it’s not just Facebook, you have got Google+ talking about 500 million users, 300 million in the stream.

Sina Weibo; we are talking about 500 million users and growing. And you have got other networks as well; Waze, which was recently bought by Google, is a GPS application, which is great, but it’s a community one as well. So you go in and you join it and you publish where you are, you plot routes.

If there are accidents on route, or if there is police checkpoints on route, or speed cameras, or hazards, you can click to publish those as well. It’s a very simple interface, so that it doesn’t interfere with your driving, or it’s minimal interference with your driving. And I will come back to why that’s interesting in a few minutes.

And I am rushing through this because I have got 50 something slides and James wants me to do it in 15 minutes. So here are some of the use cases from all that data, and there are some nice ones out there. A lot of you are probably familiar with this one; it’s the UK snow meteorology example. It was one that was put up a couple of years back and it has been used every year every time there is snow in the UK.

There is a little dash of snow over London there in this screenshot, because there wasn’t one when I went to the site, so I tweeted about it, and got a bit of snow to fall on EC 2 there.

Utility companies are starting to use social media increasingly for outage management. So GE have got this Grid Insight Application, and what they do is if a utility company has an outage in their area, they can look for mentions of the outage on social media channels. And in this picture here you see someone has tweeted a photograph of a tree, which is after taking down an electricity line, so not they have a good idea of what the issue is.

This is in real time. So instead of having to send out an investigatory truck roll, they just send out the vegetation truck roll, and that cuts down massively on the time to get the outage fixed and get people back live again.

And this is another one, you can see here there is a fire in the substation, and it’s right beside a road, and you can see a cluster of Twitter — maybe not, you would have to look closely, but those are the blue dots there, those are little clusters of tweets and Facebook posts, and you have got a Facebook video posted of the fire in the substation.

Other things; the United Nations Development Project are analyzing in real time social media. This is the project they ran to analyze social media, because they want to know when there are likely risks to their people on the ground.

This is one they did in Georgia around the time of the upset between Georgia and South Ossetia in 2008-2009. So they looked at the mentions there and they graphed it versus when the trouble actually happened. So now they are building a model so they can call their people and say, okay, look, it has gotten to the point where it’s getting risky for you guys to be in there, we need to get you out now.

Automotive; the automotive industry are starting to use this. There was an application developed by the Pamplin College in University of Virginia Tech where they started mining social media for mentions of particular, what they call, smoke terms. These were terms which are important for the automobile industry and so they can identify quickly when faults come in cars.

This is a much faster way of reporting faults back to the manufacturer rather than going back up to the dealer network, which can take weeks and months. If they are getting it directly from the consumers, they get it faster, they do the recall faster, and you have got safety issues there, you are saving people’s lives. Plus, you are also having to recall fewer cars because few of them have been sold by the time the issue comes to life.

In the finance industry; this is a paper that was published. It was published in, I think it was 2009, and it said that Twitter can predict the stock market with 87% accuracy, and again, the link is at the bottom, you can click through and read the paper.

So on the back of that this UK crowd called Derwent Capital Management licensed the technology and set up a fund, and it has now become Cayman Atlantic, and they are doing quite well apparently. And there are several other companies who are doing similar now as well, using Twitter to predict the stock market.

In law enforcement social media is huge, it’s absolutely huge. A lot of the police forces now are actively mining Facebook and Twitter for different things. Like some of them are doing it for gang structures, using people’s social graph to determine gang structures. They also do it for alibis. All my tweets are geo-stamped, or almost all, I turned it off this morning because I was running out of battery, but almost all my tweets are geo-stamped. So that’s a nice alibi for me if I am not doing anything wrong.

But similarly, it’s a way for authorities to know where you were if there is an issue that you might be involved in, or not. So that’s one.

They also use it for interacting with people. They set up fake profiles and interact with suspects as well and try and get them to admit and all that kind of stuff.

I have a few extra slides hidden here, because James asked me to crunch this down. If you do download it, you will get all the sides there, and they are some very interesting ones. If you have an interest in the law enforcement angle, there are some great case studies that you can look into there.

Obviously the law enforcement one is one you have got to be very careful of, because you have issues there around the whole Minority Report and Precrime, and it’s more of a dodgy one than many of the other ones I have been talking about.

Smart cities; we heard people talking about smart cities this morning. This is the City of Boston and they have got their citizens connect to application, and that allows people with a smartphone, and it’s agnostic; it can be Android, iOS, I am not sure if they do BlackBerry, but Android and iOS are covered anyway. You can report potholes, street lights, graffiti, sidewalk patches, whatever those are, and damage signs and others.

You get reports back when you report something to the City of Boston, and a couple of other cities are rolling these out as well, but in this particular one, when you report an issue to the City of Boston, you get a communication back from the city telling you who is assigned to fix that particular item you have reported. And then that person contacts you to say when they have done it, and often they will photograph it and you get a photograph of the item you have reported having been fixed by the named person who has done it. So very smart.

Healthcare; healthcare is a big one as well. You are probably familiar with Google Trends and Google Flu Trends, so Google Flu Trends, they take the search data to predict when there are likely flu outbreaks.

Well, they went a step further and they funded this paper, which was published in the American Journal of Tropical Medicine and Hygiene, and what they did was they looked at the data, the social media data for mentions of cholera and cholera symptoms in Haiti in 2010 after the earthquake there. And they found that the mentions of cholera and cholera symptoms on social media tracked exactly with the governmental data, so it was an exact match. The only difference being it was two weeks ahead of the government data.

So you can imagine two weeks on a cholera outbreak, the number of lives you could save, so really important stuff.

There is also this fantastic application which was called Asthmapolis and is now called Propeller Health. And what that is, it’s a little device that sits on top of an inhaler, so when you give a puff on your inhaler, it reports it with GPS and timestamp.

So when you go to your doctor, your doctor then can see a map of where and when you puffed on your inhaler, and you get to see it as well. So you start to see patterns in when you used your inhaler.

So you might say every time I visit my friend’s house, I use the inhaler more. They are a smoker. Okay, so now I need to be aware.

Or every time I am on my way to work, when I pass this particular place I use the inhaler, maybe I should take a different route.

But it goes a step beyond that as well. They have gotten the City of Louisville, in Kentucky to roll this out to all their asthma people. And they have a particular issue with pollution in Louisville, because there is a 13 year lifespan difference in people’s expected lifespan depending on where they live in Louisville.

So you live in one place, you live 13 years less than your neighbors. So they are using this application to try and help them identify and to try and help them clean up the City of Louisville, so a really interesting application there.

In CRM, Customer Relationship Management, it was T-Mobile in the U.S. who went through the millions of customer records they had, they went through their billing records, they went through mentions in social media. They had, I think it was 33 million customers, and they were losing customers all over the place.

When they started analyzing the social media mentions, matched it up with the billing records, etcetera, and they started taking preventative action for people they identified as likely to defect, they halved their defections in three months.

So they cut down on their customer defections, in three months they cut them down by 50%. Amazing!

Brand management; a couple of years ago Nestlé got Greenpeace. They were sourcing palm oil for making their confectionary from unsustainable sources, from — Sinar Mas was the name of the company and they were deforesting Indonesia to make the palm oil.

So Greenpeace put up a very effective viral video campaign to highlight this, and this actually had an impact on Nestlé’s stock price, short-term, small impact, but it had an impact on their stock price, as well as the reputational issues.

Nestlé put in place a Digital Acceleration Team who monitor very closely now mentions of Nestlé online and as a result of that this year, for the first time ever, Nestlé are in the top ten companies in the world in the Reputation Institute’s Repute Track Metric. So they are now considered globally as one of the more reputable industries, at least partly as a result of this.

In transportation; I mentioned Waze earlier. So Google Maps have now started to incorporate data from Waze. So right here you can see a screenshot of someone’s Google Maps and it’s highlighting that there was an accident reported on this particular road via Waze, via the Waze App. So that’s really impressive, you are on your Google Maps and now you are notified ahead of time that there has been an accident up the road, you have a chance to reroute.

Also in transportation, this is a lovely little example; Orange in the Ivory Coast, they took, I think it was — I have it noted here somewhere, 5 million Orange users, 2.5 billion anonymized records from their data.

Anonymized released it and said, okay, let’s see what you can do with this anonymized data from our customers. There is a competition. The best use was where they remapped the country’s public transport because they could see looking at people’s mobile phone records where people were going during the day.

So they said, okay, people are going from here to here, but our bus route goes from here to here, to here, to here, let’s redraw the bus route this way where people actually want to go. Simple! Beautiful application of data, the data that we all published all the time, to make people’s lives easier. They reckon they saved the first 10% of people’s commute times.

Looking ahead, and I am wrapping up here James, wherever he is, you have got things like Google Glass, which will now be publishing people’s data as well.

You have got this thing called Instabeat, and what it is, it’s like Google Glass for swimmers. So it has got a little display inside people’s goggles as they are swimming, so they can see how fast their heart rate is; they can see several of the kind of things that you want when you are a competitive swimmer and you are trying to up your game.

And you have got all the usual stuff that we are all aware of, the Jawbones and all these other things that people are using to track their fitness.

More and more we are being quantified, we are generating more and more data, and it’s going to be really interesting to see the applications that come from this data.

So the conclusion from all of this very quickly, data and the data sources are increasing exponentially, let’s go hack that data for good.

Thank you!

post

Social media and utility companies

I’m moderating a panel discussion on social media and utilities at next week’s SAP for Utilities event in Copenhagen. My fellow panelists will include two representatives from utility companies, and one from SAP.

This is not new ground for me, I have given the closing keynotes at the SAP for Utilities in San Antonio in 2011 and the SAP for Utilities event in Singapore in 2012, both times on this topic.

In my previous talks on this topic I start out talking about how utilities have started to use social media for next generation customer service – this is an obvious use case and there are several great examples of utilities doing just this.

However, there are also other very compelling use cases for social in utilities. In the US over one third of the workforce is already over 50 years old, and according to the US Bureau of Labor Statistics 30-40% of the workforce will retire in the next 10 years. This is not confined to the US and so recruitment and retention are topics of growing concern for utilities.

Now, utilities are rarely seen by young graduates as a ‘cool’ place to work. But this can change. Remember a couple of years back when Old Spice was the cologne your grandad might wear? Old Spice rolled out a social media campaign with a superb series of YouTube ads (the first of which has been viewed 45 million times). In the month which followed their sales went up 100%, and a year later their sales were still up 50%.

Videos like the one above produced by Ausgrid, while not about to rival Old Spice for viewership, do show a more human and appealing side of the company to any potential employees.

Rotary dial phone

Also, when I ask utility companies whether they allow employees to access social media from their work computers, the majority of times the answer is no, or limited. Even if only from the perspective of retaining good employees, this has to change. Today’s millennials are far more likely to use social media as a way to network and find information online (see chapter four of this three year old Pew Research study on Millennials [PDF] for more on this). Blocking access to social media sites, especially for younger employees, is analogous to putting a rotary dial phone on their desk, with a padlock on the dial. Don’t just take my word for it. Casey Coleman, the CIO of the U.S. General Services Administration said recently:

Twitter is a primary source to gather information about changes in my industry. It helps the organization stay current with the latest trends and thinking.

Blocking employees access to social media stifles them from doing their job effectively, and any employee who feels that s/he is not being allowed to do their job properly won’t be long about looking for a new one.

Social media can also be used internally as a means of retaining knowledge from retiring workers, and as a way of making employees more productive using internal social collaboration tools (Jam, Huddle, Chatter, etc.).

Finally, as I’ve mentioned before, with the rise of mobile usage of social media, there is now the ability to tap into social media’s big data firehose in realtime to improve on outage management.

There are bound to be more uses of social media (real or potential) that I’m missing – if you can think of any, please leave a comment on this post letting us all here know.

Also, the panel discussion is on next Friday April 19th at 3pm CET – we’ll be watching the Twitter hashtag #SocialUtils. If you have any questions/suggestions to put to the panel, leave them there and we’ll do our best to get to them.

post

Sustainability, social media and big data

The term Big Data is becoming the buzz word du jour in IT these days popping up everywhere, but with good reason – more and more data is being collected, curated and analysed today, than ever before.

Dick Costolo, CEO of Twitter announced last week that Twitter is now publishing 500 million tweets per day. Not alone is Twitter publishing them though, it is organising them and storing them in perpetuity. That’s a lot of storage, and 500 million tweets per day (and rising) is big data, no doubt.

And Facebook similarly announced that 2.5 billion content items are shared per day on its platform, and it records 2.7 billion Likes per day. Now that’s big data.

But for really big data, it is hard to beat the fact that CERN’s Large Hadron Collider creates 1 petabyte of information every second!

And this has what to do with Sustainability, I hear you ask.

Well, it is all about the information you can extract from that data – and there are some fascinating use cases starting to emerge.

A study published in the American Journal of Tropical Medicine and Hygiene found that Twitter was as accurate as official sources in tracking the cholera epidemic in Haiti in the wake of the deadly earthquake there. The big difference between Twitter as a predictor of this epidemic and the official sources is that Twitter was 2 weeks faster at predicting it. There’s a lot of good that can be done in crisis situations with a two week head start.

Another fascinating use case I came across is using social media as an early predictor of faults in automobiles. A social media monitoring tool developed by Virginia Tech’s Pamplin College of Business can provide car makers with an efficient way to discover and classify vehicle defects. Again, although at early stages of development yet, it shows promising results, and anything which can improve the safety of automobiles can have a very large impact (no pun!).

GE's Grid IQ Insight social media monitoring tool

GE have come up with another fascinating way to mine big data for good. Their Grid IQ Insight tool, slated for release next year, can mine social media for mentions of electrical outages. When those posts are geotagged (as many social media posts now are), utilities using Grid IQ Insight can get an early notification of an outage in its area. Clusters of mentions can help with confirmation and localisation. Photos or videos added of trees down, or (as in this photo) of a fire in a substation can help the utility decide which personnel and equipment to add to the truckroll to repair the fault. Speeding up the repair process and getting customers back on a working electricity grid once again can be critical in an age where so many of our devices rely on electricity to operate.

Finally, many companies are now using products like Radian6 (now re-branded as Salesforce Marketing Cloud) to actively monitor social media for mentions of their brand, so they can respond in a timely manner. Gatorade in the video above is one good example. So too are Dell. Dell have a Social Media Listening Command Centre which is staffed by 70 employees who listen for and respond to mentions of Dell products 24 hours a day in 11 languages (English, plus Japanese, Chinese, Portugese, Spanish, French, German, Norwegian, Danish, Swedish, and Korean). The sustainability angle of this story is that Dell took their learnings from setting up this command centre and used them to help the American Red Cross set up a similar command centre. Dell also contributed funding and equipment to help get his off the ground.

No doubt the Command Centre is proving itself invaluable to the American Red Cross this week mining big data to help people in need in the aftermath of Hurricane Sandy.

post

What services does GreenMonk offer?

Tom Raftery speaking at Web 2.0 Expo

A couple of people have been asking me recently what services GreenMonk offers, so I thought it might be a good idea to put some of them down in a blog post so Google knows what they are and so I can link to them when anyone asks in the future.

Advisory Services:

GreenMonk helps client companies with advice on

  • Message testing- helping to bulletproof marketing campaigns, before launch activities.
  • Product strategy and advisory – we can suggest enhancement and product directions based on trends in business sustainability.
  • We will also suggest alliances or partnerships that can enhance your product offerings or increase distribution channels and sales.
  • We will also undertake to ensure executives are aware of significant industry news, trends and events that will impact current and planned business models.

Video Services

Video is a medium which is becoming ever more popular, particularly in the post-pc age. GreenMonk videos are kept brief and to-the-point to maximise impact and reach. Also, to increase find-ability, GreenMonk TV videos are transcribed and the text is published alongside the video.

The GreenMonk TV YouTube channel, with over 150 uploaded videos and in excess of 78,000 views, drives traffic to GreenMonk’s clients. Clients are free to use video purchased in any format/media on any web property, or even offline.

GreenMonk –

  • Helps with content creation for marketing/messaging purposes
  • Showcases executive thought leadership on niche/emerging topics
  • Highlights customer success stories using trusted third party, customer interviews and
  • Documents new products/services

Blog Based Research:

One of GreenMonk’s primary publishing vehicles is the GreenMonk blog. Blog content benefits customers in the following ways:

  • The analysis can be more timely than traditional analyst reports
  • The analysis is freely available to anyone; line of business, IT staff, students, etc. at no cost
  • The analysis is given high ranking by Google, making it easily discoverable
  • The analysis can be further supplemented by comments and contributions from parties external to GreenMonk, thus enhancing its value
  • The two way nature of blogs allows for RedMonk to serve as an early warning system for potential issues with products and services and
  • The blog can also be used to re-publish video and podcasts, recorded separately furthering their reach

Twitter Based Research:

GreenMonk makes extensive use of Twitter as a research tool as well. Twitter benefits our clients in the following ways:

  • Twitter posts are immediate so it is possible to see/track stories rapidly
  • Breadth of accounts we follow means there is unlikely to be a related story or trend we are unaware of
  • Our extensive followership and many years experience of the Twitter platform means we can disperse a message quickly and effectively
  • Twitter can be used as a testing ground for messaging as well as a driver of traffic to web resources
  • The conversational nature of Twitter means that posts are often commented on (replied to) adding to their value and
  • Twitter posts are freely available to anyone; line of business, IT staff, students, etc. at no cost

Consulting Services:

GreenMonk analysts will be available to answer questions concerning competitive positioning, understanding the wider market context and providing dedicated research and information regarding emerging trends and competition.

These analyst-hours can also be applied to custom research projects, advisory and speaking engagements.

Press Availability:

GreenMonk will take the time required to understand your products, announcements, and initiatives. When questioned by members of the media, we will be ready with accurate and up-to- date information on your products, announcements and initiatives.

Image credit Tom Raftery

post

If Utilities don’t step up their customer communications, they risk their considerable smart grid investments

Smart meter

Smart grids don’t come cheap.

They are typically projects costing in the order of hundreds of millions of dollars (or Euro’s, or pounds or whatever your currency of choice). Just think, the most fundamental piece of the smart grid, the smart meter, alone costs in the order of $100. When you factor in the costs of installation, etc., you are looking at over $200 per smart meter. Therefore if you have in the order of one million customers it’s going to cost you around $200m just for the smart meter rollout.

Given that they are so costly to implement, you’d think utility companies would do everything possible to protect these projects from failure – not so, according to the latest smart grid research from Oracle.

The report from Oracle surveyed 150 North American C-level utility executives about their vision and priorities for smart grids over the next ten years. The findings are both interesting and disturbing.

It is interesting but not too surprising for example, that when asked to select their top two smart grid priorities over the next 10 years, they chose improving service reliability (45%) and implementing smart metering (41%) at the top of the list.

What is worrying though is that while 71% of utilities say securing customer buy-in is key to successful smart grid roll-outs, only 43% say they are educating their customers on the value proposition of smart grids. This is hugely problematic because, as I have written about previously, customer push-back can go a long way to de-railing smart grid projects.

And those who are educating their customers, how are they doing it?

Well, from the report, to communicate with their customers 76% of utilities use postal communications, and 72% use their own website. Only 20% use social media (and who knows how well those 20% are using their social media channels).

Tellingly, the report also mentions that only 38% of utility customers take advantage of energy conservation programs when they are made available. There are a number of reasons for this:

  1. the savings from these programs often require work on the part of the customer for no immediately visible benefit
  2. the savings are typically small (or put another way, energy is still too cheap) and
  3. Because of the extremely poor job utility companies have done on communications to-date, their customers don’t trust them, or their motivations. There is no quick fix for this. It will take time and a significant improvement in how utility companies converse with their customers before they start to be trusted

I have written lots of times over the years about the need for utilities to improve their communications.

Utilities have a lot of work to do rolling out their smart grids – but if they don’t step up their customer communications, they risk their considerable smart grid investments.

Photo credit Tom Raftery

post

The secret to following lots of people on Twitter

Tom Raftery Twitter profile Feb 14 2011

Continuing my series social media savvy for sustainability, I wrote a post on how to follow large numbers of people on Twitter – this is important to ensure you you get the most up-to-date information on your areas of interest, as quickly as possible:

Twitter is a fantastic tool for disseminating information, and the obvious corollary of that is that Twitter is a superb app for consuming information as well – depending on how you use it.

What is the best way to make sure you get the most information out of Twitter? Follow lots of relevant, interesting people!

It sounds obvious (if you aren’t following people, you won’t see their posts) but I see lots of people on Twitter who are following 100 people or less. Many of those 100 will be friends and family, others will be infrequent posters so out of 100 accounts, you are lucky if 20 are regular sources of good information.

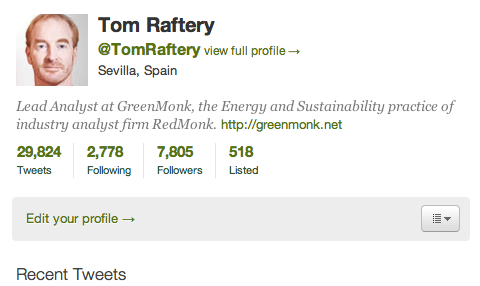
Now, what if you increase the number of people you follow to 200? Or 2,000 (I’m currently following 2778)? Well then, the number of friends/family type accounts you’re following is unlikely to increase proportionally, so as long as you chose the people to follow wisely, you will vastly increase the amount of interesting news you will be receiving from Twitter.

Now, I often hear people say they have difficulty keeping up with the number of people they are following and asking me how I follow over 2,000. The simple answer is I don’t try to keep up with all the people I follow! I dip in and out of Twitter and if the people I follow happen to post, I will likely see the post. If they post when I am not looking at Twitter, I probably won’t see their post.

And that’s fine.

The major limiting factor in trying to follow more people on Twitter is obsessively attempting to catch every tweet. Let go. Learn to live in the now and more than likely if you do miss an important tweet, it will be re-tweeted anyway.

Of course, a flipside to this is that you shouldn’t follow people simply to increase the number of people you are following. Only follow people who will bring you useful/interesting information – otherwise you are reducing the signal-to-noise ratio and similarly if you realise that someone you followed is not bringing you any value, don’t hesitate to unfollow them.

So, how do you find interesting people to follow on Twitter? That’s a topic for another blog post – stay tuned!

You should follow me on Twitter here

post

15 Twitter tips for beginners – updated

Twitter home page

I wrote a post a couple of years back called 15 Twitter tips for beginners which, though two years old, still has useful information for Twitter users – especially if you make sure to read all the comments as well.

Needless to say, things have moved on considerably in the intervening period – bear in mind that post was written over a year before the launch of the iPad and seven months before version 1.0 of Android was released!

So here’s a quick updated version of the tips:

  1. Start off easy by posting a few innocuous posts introducing yourself and your interests, “I’m Tom, a Social Media and Sustainability expert”, “I recently moved to Seville, anyone on here from Seville?”, – that kind of thing. Then be sure to mention why you’re using Twitter, e.g. “I hope to learn more about cleantech”, or whatever it is you are hoping to get from it.
  2. Then build up your network. Start with friends who you know to be on Twitter. Start following them. But also look at the list of people they are following. You may know some of them too, if so, follow them as well.
  3. If you precede someone’s username with the @ symbol in a post on Twitter (i.e. “@tomraftery how is it going?”) then your post appears in the @Mentions tab on their Twitter page. This works whether they are following you or not. When you @reply to someone, and they see you appear in their @Mentions tab, they are likely to check out your profile and posts and may decide to follow you. This is a very powerful way to build up your network with people who don’t necessarily know you but with whom you want to connect.
  4. Check out the TwitterGrader page for your area, for instance, if you are based in Andalucia, in the south of Spain, like me, check the TwitterGrader page for Andalucia and you’ll find some interesting people you may want to connect to, to get into the local scene.
  5. Follow some of the people there, check who they are following and talking to (@ replying to) and consider following them too.
  6. Sidenote: if you precede someone’s username with “d ” (i.e. “d tomraftery how is it going?”) this sends a private message only to them – called a direct message or DM. You can only send DMs to people who have chosen to follow you.
  7. Also, don’t be shy about asking your friends to pimp you to their followers!

  8. Then, using Twitter:

  9. On the computer use either Seesmic Desktop or TweetDeck for posting/reading posts. I prefer TweetDeck. Having said that, the Twitter web interface is still prob the best for checking people’s profiles and seeing who they follow.
  10. On the iPad /iPhone I use the Twitter iPhone client; On Android, I’m told Tweetdeck is best; and on Blackberry I hear Seesmic, Tweetcaster and Socialscope are good (though Socialscope is still in private beta) and
  11. On any phone the Twitter mobile interface and dabr – are great web-based mobile Twitter clients
  12. Always remember, if you @reply someone looking to get their attention or hoping they will follow you, they will likely click through to check out your Twitter page. There are many bots on Twitter so to weed out real/interesting users from bots I always look at a persons most recent posts to see what they are talking about (if their posts are all links to one site, forget it!), I look at the number of people they follow vs the number of people following them. If they are following 1,000 say and have very few followers, it is a sure sign that they are a bot who just auto-followed lots of people.
  13. I also check out what the person says about themselves in the bio (so, if you want people to follow you, be sure to fill in your own bio!) and click to view their website site, if they have one .
  14. If you want people to follow you, then ensure your updates are not protected. Someone coming to your Twitter page and seeing Protected Updates is very unlikely to see any reason to follow you.
  15. Purely a personal preference, but I think it is far better to use your own name on your Twitter account than a handle. It is a matter of personal branding but to my mind, a Twitter account called @JohnDoe tells me more about the user than @stargazr49!
  16. Finally, a photo is also very important on your account, be sure to add one to your profile
  17. BONUS EXTRA TIP!!! – Use your Twitter username everywhere – add it to your email sig, put it on your business cards, leave it in blog comments – don’t spam, just do it where appropriate.

FWIW I’ll be writing many more posts about Twitter best practices, with a special emphasis on Twitter for Sustainability obviously, in the coming weeks and months – stay tuned!

Cross posted from my TomRaftery.com blog

You should follow me on Twitter here

post

Cloud Energy Consumption: Google, Twitter and the Systems Vendors

Yesterday Tom posed a question: just how green is cloud computing? We have been frankly disappointed by Cloud computing providers reticence to start publishing numbers on energy consumption. We know for sure that energy is a big deal when it comes to the huge data centers the likes of Facebook are building- these firms are siting data centers next to rivers to take advantage of hydro-electric power, and in Google’s case are even looking at building their own wind turbine farms.

Some of you may remember the huge fuss when Alex Wissner Gross, a researcher from Harvard University estimated how much energy the net consumed, which became a Sunday Times story about Google Searches in terms of kettles boiled. The story claimed:

performing two Google searches from a desktop computer can generate about the same amount of carbon dioxide as boiling a kettle” or about 7g of CO2 per search

Perhaps surprisingly, Google responded, to debunk the news story:

In terms of greenhouse gases, one Google search is equivalent to about 0.2 grams of CO2.

The story petered out- which is somewhat of a shame. A real, open debate, with shared figures, bringing in all of the main players, would clearly benefit us all. With that in mind I was pleased to see that one of Raffi Krikorian, tech lead of the Twitter API team, chose to talk about power/tweet at the company’s Chirp developer conference last week:

In summary, Raffi estimated that energy consumed is around 100 Joules per tweet.

Before jumping to a conclusion that Twitter is more efficient than Google its important to note that Raffi’s estimates, unlike Google’s, don’t include the power of the PC in the equation. You should also watch the video of his presentation – for the simple reason that Raffi seems to channel Jay-Z in his presenting: the guy’s body language is straight out of a hip hop video.

I discussed Twitter’s “disclosure” with my colleague Tom this morning. He questioned its value because its an estimate, rather than a measurement. He has a point. It may be however that Raffi is just the man to take this debate to the next level. He is clearly deeply technical, can think at the level of the isolated API – and is finally a Sustainability advocate of note- I first heard of him through his seminal How Valentine’s Day Causes Global Warming riff.

We need to encourage competition on the basis of power efficiency.

I’d like to close with a call to action. Surely its time for the major web players to get together with Dell, HP and IBM in order to agree standards so we can move from estimates to measurements of Cloud energy consumption, perhaps using AMEE ($client) as a back end for standard benchmarks. You can’t have sustainability through obscurity. Open data is key to working through the toughest environmental challenges.

post

Renewable energy supply and demand

Supply and demand

Photo credit Milton CJ

I ReTweeted a couple of posts yesterday from HP’s Ed Gemmell. The posts from Ed were some data about HP’s use of renewable energy in various EU countries. The retweets were:

  • RT @EdGemmell: HP Ireland running on 50% wind power saving 27,000 tonnes CO2
  • RT @EdGemmell: HP in Italy has been running on 100% hydro since Jan09 saving 15,000 CO2 PA
  • RT @EdGemmell: HP in UK has been running on 100% hydro since Feb09 saving 46,000 tonnes CO2 PA and
  • RT @EdGemmell: HP in Germany has been running on 100% hydro since Jan09 saving 37,000 tonnes CO2 per year

Some nice data there and kudos to HP.

Another Twitter user, Thomas Bjelkman replied very quickly with the following response:

@TomRaftery Re HP and hydropower. If the energy mix in the market is the same then the CO2 has only moved from one customer to another.

And, to an extent he is correct. If suppliers in a market generate 200gWh for example, 50% of which is from renewables then you have 100gWh of renewable energy to go around. One co. preferentially buying 10gWh means by definition that there is less renewable energy (100gWh – 10gWh = 90gWh) to go around for others.

However, the flipside is that if companies are preferentially purchasing/looking to purchase renewable energy, this increases demand in the market. And an increased demand signal invariably leads to an increased supply (as suppliers see more demand, it makes sense to invest in more renewable generation to meet the demand).

So, companies who favour renewable energy (and especially if they publish targets to increase the amount of renewables they are purchasing) are de facto helping to increase the penetration of green power on the grid.

More of it, I say.