post

The Global Reporting Initiative, their new CEO, Social, Mobile and Big Data

Michael Meehan - GRI new Chief Executive

We were delighted to hear this week that friend of GreenMonk’s for many years now, Michael Meehan was recently appointed as CEO of the Global Reporting Initiative (GRI).

The GRI is a non-profit organisation that produces one of the world’s most prevalent framework’s for sustainability reporting. One of the GRI’s main aims is to make sustainability reporting by all organisations as routine as, and comparable to, financial reporting.

Michael takes over the GRI at an interesting time. As we reported here on GreenMonk recently, the interest in sustainability reporting is on the rise globally

carbon scores are now not only showing up at board level, but are also being reported to insurance companies, and are appearing on Bloomberg and Google Finance. He put this down to a shift away from the traditional regulation led reporting, to a situation now where organisations are responding to pressure from investors, as well as a requirement to manage shareholder risk.

In other words the drivers for sustainability reporting now are the insurance companies, and Wall Street. Organisations are realising that buildings collapsing in Bangladesh can have an adverse effect on their brand, and ultimately their bottom line.

On a call to Michael earlier this week to congratulate him on his new role, he mentioned that while around 6,000 organisations currently report to the GRI, his aim is to increase that number to 25,000 organisations.

To do that, at the very least, the GRI needs to embrace social, mobile, and Big Data.

The GRI has traditionally operated below the radar, but in order to grow the GRI, never mind growing it to 25,000 reporting organisations, working quietly is not sustainable. It has to become more aggressive with outbound communications – social in particular. While the GRI has a Twitter account with over 15,000 followers, there’s no mention of the account anywhere on the GRI’s website. Worse again, the organisation’s Facebook page is one automatically generated by Facebook based on Facebook users posts and interests (!), and the organisation’s Youtube channel was similarly generated automatically by YouTube’s video discovery system.

On the mobile front, the organisation’s website is not mobile aware. Nor does it have any mobile apps in the main app stores. In a time when more and more web browsing is going mobile, the GRI urgently needs to formulate a mobile strategy for itself.

And finally, on the Big Data front, in our conversation Michael expressed a definite interest in making the GRI’s terabytes of organisational information available as a platform for developers. The data is a huge repository of information going back over years. The ability to build analytics applications on top of this would yield massive benefits, one has to think.

Fortunately for the GRI, Michael is a serial entrepreneur with a history of successful exits in the sustainability space. If anyone can modernise the GRI, he can. We wish him all the best in his new role.

post

Dell launches its 2020 Legacy of Good Plan

Dell water bottle

Yesterday (Oct 15th 2013) Dell published their 2020 Legacy of Good Plan. In this plan they commit to

leaving a positive, measurable, and lasting contribution to out planet and our society.

Lofty goals indeed, but what about some of the more concrete specifics? Well Dell has published 21 concrete goals with an end-date of 2020 by which they have to achieve them.

The goals cover three distinct categories, Environment, People and Communities.

The Environmental goals include:

  • Reduce greenhouse gas emissions from our facilities and logistics operations by 50%
  • Reduce the energy intensity of our product portfolio by 80% and
  • Ensure 100 percent of Dell packaging is either recyclable or compostable

The People goals include:

  • Increase university hiring to a rate of 25 percent of all external hiring
  • Engage 40 percent of our global Dell team in employee resource groups by 2020 and
  • Achieve 75 percent favorable responses (or higher) in team member satisfaction globally as measured through the annual employee satisfaction survey

While the two Community goals are:

  • Engage 75 percent of team members in community service by 2020 and provide 5 million cumulative hours of service to the communities in which we live and work and
  • Apply our expertise and technology in underserved communities to help 3 million youth directly and support 10 million people indirectly to grow and thrive

The goals are all extremely laudable and measurable, and Dell has committed to transparency in the process. It will be interesting to watch Dell’s progress with the plan, especially as we come closer to the end-date 2020.

Dell claims to have worked closely with its customers in formulating this plan, but according to this Twitter conversation, not all Dell’s customers are on-board, as yet

An obvious goal missing from the People section would be to increase the number of female executives in the organisation, though Dell is already one of the top US companies for executive women. No harm to have written goals for this too though.

Finally while discussing this initiative with David Lear, Dell’s Executive Director of sustainability programs, I asked him what was going to happen to this program given Dell’s move from being a publicly traded to a privately owned company. He responded that because the plan was generated in consultation with Dell’s customer base, those customer’s were unlikely to change significantly after the privatisation, and Dell’s commitment to them wouldn’t change either.

post

SAP releases its Integrated Report 2012 – an integrated financial and sustainability report

SAP released their first Sustainability report in 2008 (their 2007/2008 report). Like the reports of most other companies at the time, it was released as a PDF document but SAP quickly shifted gears. SAP’s 2008 Sustainability report, was released as a website. This had the dual purpose of making the site more accessible, and also allowing SAP to see which areas of the site had more traction. The following year they made their report more social and every year since they have added something new.

As well as releasing its Sustainability reports each year, SAP also published its annual financial reports. This year, for the first time, SAP have integrated the two reports and they have just published their SAP Integrated Report 2012. It takes the form of a highly interactive website with built-in analytics and downloadable PDF’s.

This was an idea GreenMonk first mooted when I asked SAP’s Chief Sustainability Officer Peter Graf in a 2011 interview whether SAP had any plans to integrate the two documents.

On a conference call at the launch of the integrated report, SAP Chief Accounting Officer Christoph Hütten went to great pains to stress that this wasn’t merely the content of both reports in one, but that the content was very tightly bound together. The report demonstrates how connections and inter-dependencies between financial and non-financial performance impact each other, he said.

The document/website contains all the financial and sustainability-related information you would expect to find in reports of this type. And the report also has a nice page showcasing and explaining the connections between the financial and non-financial performance.

Other nice features of the report are an integrated tweetstream showcasing mentions of the #sapintegrated hashtag on some pages, an option to make notes on pages (with the ability to download those pages as PDF’s subsequently), and the download centre for downloading the annotated pages, as well as financial statements, graphics and other reports.

For the first time also, SAP are releasing their 2012 sustainability information in XBRL format (.zip file) – something GreenMonk also suggested to SAP back in 2011. If you are unfamiliar with XBRL, it is an XML-based global standard for exchanging business information.

Impressive as well was the fact that at the end of the conference call launching the report, Peter Graf mentioned that SAP are actively looking to co-innovate. He asked that anyone, be they in the financial or sustainability reporting space, who is interested in integrated reporting get in touch with him to work together to bring integrated reporting to everyone “at the lowest possible cost and highest possible precision”.

The video above is a demo of the report and I have placed a transcript of the video here.

post

SAP’s 2010 Sustainability Report demo’d

I had a Skype chat recently with SAP’s Chief Sustainability Officer Peter Graf where he gave me a demo of their new 2010 Sustainability report.

With Peter’s permission, I recorded the demo for publication on YouTube. The video above is the result and the transcription is below.

Some highlights Peter mentioned include:

  1. More sustainable operations have saved SAP ?170 million (!) between 2008 and today,
  2. SAP are updating their Sustainability report quarterly and are embedding it more and more closely with their financial reporting and,
  3. SAP have deep social media embedding in their report

With this report, SAP have put clear blue water between themselves and any other sustainability report. SAP can still take it up another few notches (productising it, putting an api in front of it, publishing in xbrl, etc) but this is the kind of reporting everyone needs to be moving to, as a baseline. Kudos to SAP for once again setting the bar with this report.

Now here’s the transcription of the demo:

Tom Raftery: Hi, everyone. Welcome to GreekMonk TV. We are talking today to SAP?s Chief Sustainability Officer, Peter Graf, who is going to give us a quick demo of the new 2010 SAP Sustainability Report.

Peter Graf: So, this is SAP?s 2010 Sustainability Report, which people can find online at sapsustainabilityreport.com. The report lays out the three key areas of impact for SAP. In the first place, SAP wants to become a more sustainable company, so we are talking about our own sustainability performance. The second section of the report is about how SAP helps customers to run more profitably and sustainably, so that?s mostly a conversation about our applications and software solutions.

And then finally, there is a section on how people at SAP drive opportunity for others through IT. And then, certainly the last part, as always when we put our report on the line is that encouraging into action and dialog between us and those who come and visit the report. And we call that section Do Your Part and that describes how everyone can contribute.

Tom Raftery: Great. Can you show me some of the details of how SAP have done in the last year? How does it look onscreen, because it?s very different from any other sustainability report that?s out there?

Peter Graf: Exactly. So before we go there, the data that we talk about is all assured by KPMG, and there are two levels of assurance and yes, this report is A+ from GRI perspective. It?s got the best rating that you can get from GRI. It complies with a whole variety of standards, but most importantly, we have not only done limited assurance to our greenhouse gas numbers, we?ve actually gone for reasonable assurance, meaning the assurance company actually assures that this is really our footprint. And we do that because we believe in the future there will be much more scrutiny around how people are reporting greenhouse gas emissions.

And that?s what the greenhouse gas emissions look like. You can see the trend from 2000 to 2007; we?ve always increased our emissions. In 2007, we set ourselves the goal to reduce our emissions step-by-step back to the level of 2000 by the year 2020, so we have an absolute carbon target. That is pretty aggressive considering that in 2000, we had about 24,000 employees and already today in 2011, we have more than 50,000 employees and we want to obviously continue to grow as a company.

You can also see that we have kind of flipped the chart to kind of visually highlight that emissions are seen as a liability to SAP so they show below the line.

Tom Raftery: And clicking on any of those bars redraws the kind of pie chart on the right?

Peter Graf: Exactly, so you can go and drill into the different years and you can see how the emissions change. For example in 2008, we had 31% of our emissions from flights that also tells you that we include Scope 1, 2 and 3 emissions in our calculation.

That number dropped dramatically in 2009, given that in the times of economic crisis, we just don?t service as many customers, so you can see that here. And then in 2010, the number continues in absolute terms to be reduced, which is amazing given that we have actually increased our revenues by 17% in 2010 while reducing our emissions. You can see that very nicely when you look at the carbon emissions on a Euro basis. We are now at 33.9 grams per Euro revenue and in 2008, that number was 45.6 grams.

So, in terms of carbon efficiency we have dramatically accelerated and you can drill into different areas. For example, revenue in the Americas, you can actually go and look at different scopes and include or exclude them in the competition. So that?s the benefit of having this kind of interactivity.

Tom Raftery: The obvious question that comes to mind then is, if you are spending all this money on getting carbon out of your system, out of your organization, it must be costing the company a small fortune.

Peter Graf: Yeah, that?s the secret sauce I would say, because what we do at SAP is from the carbon perspective, we have a very, very good idea about where we need to kind of have activity in order to have a positive financial impact. So, here you see the SAP specific abatement cost curve that we have, which is produced with the help of SAP carbon impact and you can see, for example, for every ton of carbon that we avoid using video conferencing, the company saves ?654 and there are 39,000 tons that we can abate that way. So, the width of every one of those rectangles describes how much carbon we can save, the height describes the financial impact.

We have done an analysis in terms of a business as usual case, so we extrapolated our carbon performance from the 2000 to 2009 further into the future in the business as usual case and in comparison to that business as usual case Tom, we saved ?170 million. So, 170 — so it looks like this is expensive stuff, but in reality for us, we live the sustainability business case and we are bringing in savings by becoming more energy efficient.

Tom Raftery: So, you are also going beyond not just in terms of presentation and interactivity, but you are also going beyond what most of the companies are doing as well by reporting not just once a year or not just once every two years as some companies are doing, but once every quarter?

Peter Graf: That?s correct. And we?ve just announced our first quarter results. We have a 6% increase in carbon for the first quarter of 2011, which we can easily track to a 5% increase in employees and we have had a very, very good performance last year in terms of carbon, so we need to keep on our toes and do the right things.

I want to highlight one element which is our increasing renewable energy, which went from 16% to 48% last year globally. Again, you can see the type of charts we used. Below the line, we have fossil and nuclear sources for electricity; above the line, we have renewable sources like wind and hydro. So there is a big shift going on between 2009 and 2010, how we source our electricity and the beauty of this chart, below the chart we show how we do less bad and above the chart we show how we do more good and the change is pretty significant.

I mean, look in 2009, we had probably 16% total renewables and the number has grown so much. While in addition, the absolute number of gigawatt hours of electricity we consume has been reduced to 268 from 301. So, our strategy is to reduce the distance from this point to that point and at the same time shift the whole thing up.

Tom Raftery: Are you doing any — or have you plans to do any integration with your financial reporting?

Peter Graf: This report is actually launched in an integrated fashion with our financial report. So for example, if I go and look at the overall performance and I?m interested in revenues for example, if I click on that what is happening is that I?m branching out to SAP?s annual report. So, there is no redundancy and the way how these reports are designed you know, there is — from a layout perspective the same kind of branding and so, the two reports are interconnected, so we avoid redundancy.

We are not yet in one report, but we have taken a significant step, because we are launching these reports at the same time on the web and they are linked with each other. So, that?s an intermediate step, but the trend certainly goes to what one report is.

Tom Raftery: Last question, I?m a big user of Twitter and to a lesser extent Facebook as you know and I see a little Fs and Ts up there in the top right. I assume this means that I can take parts of the report and drop them into Twitter and Facebook and I see a LinkedIn link there as well?

Peter Graf: Yes, exactly. So first of all, it?s interesting to see that there are really conversations going on, on the right. People can rate these and you can look at things from a time perspective or most popular. You can always share comments and when you do, you are asked to use your credentials in one of those social websites to go and leave a comment.

So, for example, I can now login in Twitter and use my Twitter account here and sign in. At that point in time, I?m brought back into the application, now I?m logged in into the report and when I share something now, I?m actually putting something out there.

I don?t want to type in this is a test, but when I do, you are getting the question, if you want to tweet it at the same time as leave your comment on the report. And in this way, we get a lot of traffic, because these comments go out on Twitter and on the web into Facebook and people come back to the actual site.

The other beautiful element of the logging in is that you can really ensure that your voice is heard. So for example, this is our materiality matrix and it?s a way for us to have structured feedback from people that go to the report. You can see how over time materiality changed, so things became more important, things became less important and this is a real time feed.

So, I can actually go in, open this matrix and drag and drop points there according to what I think is important for me and for things that I think that are important for SAP. And when I go and save this, very interesting things happen, this data comes back to SAP and we can actually go and look at the navigated view and that?s what I can show you right now.

So, if I go to real time this is the aggregate of all the hundreds of people that went there and communicated to us what they deemed to be important and what not. And people are really making up their mind; there is a lot of ?Yes or No.? It?s pretty clear what?s in and what?s not so important and we like that, they are better — that?s a great feedback for us.

There is one more thing Tom that I would like to highlight, which is the impact we have now taken, not just our own operational impact, but really the impact we have on a greater scale. And we have done some estimates in terms of what is the impact of SAP through its customers on the world.

So, for example, we believe that our sustainable supply chain solution help about 800 million consumers live safer and healthier. In other words, the product safety capabilities that SAP brings to the table combined with the large amount of customers in the consumer space of SAP have delivered significant value to everybody and that?s how we are describing that.

These are estimates and we want people to comment to how we get to the number, because we explain it in detail, this is how we get to this number and we really would like more feedback from everybody in terms of how we measure that and how that could be improved.

So, if anyone has a comment, please leave it up here.

Tom Raftery: Cool, Peter that?s been fantastic. Thanks a million for that, thanks for coming on the show.

post

Green bits and bytes for Feb 10th 2011

Green bits & bytes

.

Some of the Green announcements which passed by my desk this week:

  1. Digital Lumens announced that its Intelligent Light Engines have received NOM (Normas Oficiales Mexicanas) and UL (Underwriters Laboratories Canada) marks, which are respectively Mexican and Canadian certification equivalents of UL Listing in the United States and allow the products to be sold in Mexico and Canada.
  2. CA Technologies and Capgemini announced a partnership to establish a global Energy, Carbon and Sustainability Business Process Outsourcing (BPO) service. The idea of the partnership, is to help customers better manage complex sustainability data collection and increasingly challenging reporting demands, enabling them to focus on sustainability strategy and carbon reduction activities.
  3. Sandbag.org.uk has reported that the EU Commission has voted to ban industrial gas offset credits from HFC and N20 destruction projects from the next phase of the EU Emissions Trading Scheme, beginning in 2013. This, they say, is important because it shows a willingness to fix the problem on the part of the politicians and because it shows that campaigning works!
  4. CA Technologies have announced that Cynthia Curtis has been promoted to vice president and chief sustainability officer
  5. Career Intelligence (i.e. recruitment) site Vault.com has launched a new section of their site dedicated entirely to Corporate Social Responsibility (CSR). The new CSR area of the site helps jobseekers discover the types of careers in this burgeoning field, and commentary on how CSR is changing traditional career fields.
  6. Boston-Power, maker of high-end lithium-ion batteries, recently announced the installation of Keith Schmid as CEO. Schmid takes over from company founder Christina Lampe-?nnerud will become executive chairman. Schmid joins Boston-Power from Power Distribution, Inc., a provider of power distribution equipment and services, where he served as president and chief executive.

You should follow me on Twitter here

Photo credit Nick Harris1

post

Friday Green Numbers round-up for Jan 14th 2011

Green Numbers

And here are this week’s Green numbers…

  1. 2010 ties 2005 for warmest year on record

    Last year tied with 2005 as the warmest year on record for global surface temperature, US government scientists said in a report on Wednesday that offered the latest data on climate change.

    The Earth in 2010 experienced temperatures higher than the 20th century average for the 34th year in a row, the National Oceanic and Atmospheric Administration said.

    Overall, 2010 and 2005 were 1.12 degrees Fahrenheit (0.62 Celsius) above the 20th century average when taking a combination of land and water surface temperatures across the world, it said.

    Those two years were also the highest in temperature since record-keeping began in 1880.

    Last year was the wettest on record, NOAA said citing Global Historical Climatology Network which made the calculation based on global average precipitation, even though regional patterns varied widely.

    When it came to hurricanes and storms, the Pacific Ocean saw the fewest number of hurricanes and named storms, three and seven respectively, since the 1960s.

    But the Atlantic Ocean told a different story, with 12 hurricanes and 19 named storms, which include tropical storms and depressions, marking the second highest number of hurricanes on record and third highest for storms.

  2. IBM Reveals Five Innovations That Will Change Our Lives in the Next Five Years

    IBM formally unveiled the fifth annual “Next Five in Five” ? a list of innovations that have the potential to change the way people work, live and play over the next five years:
    ? You’ll beam up your friends in 3-D
    ? Batteries will breathe air to power our devices
    ? You won?t need to be a scientist to save the planet
    ? Your commute will be personalized
    ? Computers will help energize your city

  3. Chris Tuppen’s 20 year CRS reflection

    Chris left BT after a long and influential career in the company to pursue new pastures in sustainability. He kindly agreed to provide some personal reflections after a 20 year career in the field.

    Reflecting back over twenty years of corporate sustainability and then attempting to summarise that into a 500 word blog is an almost impossible task.

    Much has changed. Twenty years ago…

  4. GE buys 3rd energy co. in 3 months – Lineage Power for $520m

    General Electric has made its first move into the fast-growing business of cutting electricity consumption by the telecoms and computer industries, buying Lineage Power for $520m from The Gores Group, a private equity firm.

    The deal is GE?s third acquisition of an energy business in the past three months, as the group implements its plan to focus on infrastructure markets and reduce its reliance on financial services.

  5. Top 10 Carbon Reporting Trends in 2010

    Corporate greenhouse gas emissions reporting continues to evolve at a rapid pace. As we celebrate the New Year, it’s instructional to take the opportunity to reflect on the highlights of 2010 and their impact on this market. Many of the changes are healthy as sustainability and emissions reporting moves away from “feel good” disclosures towards risk identification and competitive advantage.

    Here is my list of the top 10 Carbon Reporting Trends in 2010…

  6. Siemens constructing 65km 2GW HVDC line between France and Spain

    Siemens Energy is currently erecting the power converter stations for a high-voltage direct-current (HVDC) transmission link between Baixas, to the west of Perpignan in France, and Santa Llogaia, south-west of Figueras in Spain, as important components of the Trans-European Network for electrical power. The installation can transmit a rated power of 2000 megawatts (MW) ? enough to transport large amounts of electric power with a minimum of transmission losses.

  7. Why Greentech Money Is Sliding From Supply to Demand

    With 2010 finally behind us, and a full year of data to play with, it appears that green technology investments are firmly shifting from the supply side of the equation to the demand side. In other words, solar and wind power were on the outs last year, and energy efficiency was the up-and-comer.

    That?s the conclusion I draw in my weekly update at GigaOm Pro (subscription required), and while it may not come as a surprise to industry watchers, it?s nice to have some numbers to back it up. Although solar startups continued to draw the most money in venture capital investment last year, energy efficiency startups garnered…

You should follow me on Twitter here

Photo credit millicent_bystander

post

Green Bits and bytes!

Green bits

Photo credit lissalou66

A few announcements crossed my desk in the last week so I thought I’d wrap them up in a Bits and Bytes post:

  1. AlertMe, a company providing online energy management software, was named the winners of the “Software in Design” category at the Institution of Engineering and Technology Innovation awards recently. The prize was conferred on AlertMe for its “use of advanced software techniques within an engineering design process?. Entries were judged on innovation in the context of social, economic and personal impact as well as its novelty (new to humanity) and process.
  2. Logica just published their 2009 Sustainability Report. It is written using the GRI index and achieves an A rating. The report is a 16.8mb PDF download (which unfortunately failed to download for me which downloaded fine today and is a well presented, 70 page document outlining Logica’s CSR initiatives in 2009) – it would certainly benefit Logica to publish it online next time (if only to get feedback on how people read it).
  3. and

  4. Tropos Networks was selected by Burbank Water and Power to be a supplier for their Smart Grid rollout. Tropos? GridCom architecture will be used as the high performance wireless distribution area network, providing secure connectivity for multiple utility Smart Grid applications.

    Not familiar with Tropos? See my interview with their CEO, Tom Ayers here

post

Walmart rocks Sustainable Supply Chains. But who stole the blogs?

Having praised its program to the skies on the video above I thought I’d check out the latest blogs that explain the thinking of Walmart purchasers. Sadly however the program I talk to seems to have dropped off – the company’s checkout blog is now looking sadly neglected.

To be fair Walmart is now writing blogs about sustainabily on higher traffic properties- notably with its monthly TreeHugger column.

Walmart is still doing the hard important work, clearly, but what impressed me about some of the blogs from its procurement professionals was the openness of them, the observability that gave us insights into the thinking behind its product decisions, the story and narrative behind the changes the company is driving.

Walmart demands 100% traceability of fish from Brazil. think what that means in practice. just one amazing program

Pretty amazing eh? I mean- how do you do that? Exactly- I want to know more about facts on the ground, and the human and technology stories behind the change. Sustainability outcomes are great, but stories drive behavioural change. So more stories please Walmart.

The video was taken at SAP TechEd 2010 in Berlin by Jim Spath, who leaves no trace other than his blog posts. The second half of the video has some great additional insights from Timo Stelzer, SAP’s Solution Manager for GreenIT – a great guy – you’ll be hearing a lot more from him in terms of working with Greenmonk.

post

Friday Green Numbers round-up 07/30/2010

Green Numbers

Photo credit Lauren Manning

And here are this week’s Green Numbers:

Posted from Diigo. The rest of my favorite links are here.

post

Symantec’s Sustainability Story: It’s The Power Consumption, Stupid.

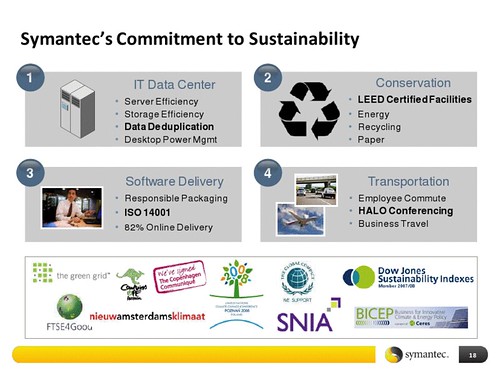
symantec commitment

I was lucky enough recently to meet Jose Iglesias, the guy spearheading Symantec’s sustainability efforts. I wrote the interview up over on Monkchips, but much of the content belongs here too. I like Symantec’s clear focus on energy. While others are broadening their sustainability story, Symantec is doubling down on managing energy more effectively, with a plan to take its expertise in reducing IT power consumption and start applying it to broader Smart Grid demand response.

Symantec?s Green IT story is very much an enterprise play and arguably a solid sustainability product strategy could help to increase visibility for some of Symantec?s enterprise tools. Thus for example ? Symantec NetBackup PureDisk for storage deduplication could be used to cut the amount of storage and power. One challenge for Symantec is identifying and serving the new buyers in energy reduction. Most of the firm?s traditional practitioner purchasers are not tasked with reducing the energy footprint of the products they manage?.

?We sell to admins, but few get compensated on energy savings?

To which I would say? not yet.

Smart Grid as Game Changer

One major opportunity for Symantec to change the account management game there is to parlay its IT experience directly into related spaces such as Smart Grid security and asset management. I knew before the briefing that Symantec is having some early success in the Smart Grid market selling, for example, cryptography. Security is a major issue overhanging smart grid and remains a key selling point.

I am not a fan of FUD though it certainly works. But let?s get real. In Europe for example we?re getting all excited about the need for smart grid standards to prevent tampering with our energy supply. Yet Russia could turn off a gas tap and we?d be screwed within weeks, no smart grid required. Whichever way you look at it ? energy reduction is going to be very big business indeed. The tail is starting to wag the dog.

So Symantec has plenty of potential upside in Green IT near term, and smart grids longer term. If you’re interested in learning more about the company’s efforts and products in energy efficiency check out the Monkchips post, which also talk to the fact the firm needs to improve its sustainability reporting in order to have a stronger voice in the sustainability conversation. I know many of you are CSR reporting nuts…