post

IBM to increase the amount of renewable electricity it procures

IBM branded battery

After returning from IBM’s InterConnect conference recently we chided IBM for their radical opaqueness concerning their cloud emissions, and their lack of innovation concerning renewables.

However, some better news emerged in the last few days.

The Whitehouse last week hosted a roundtable of some of the largest Federal suppliers to discuss their GHG reduction targets, or if they didn’t have any, to create and disclose them.

Coming out of that roundtable, IBM announced its committment to procure electricity from renewable sources for 20% of its annual electricity consumption by 2020. To do this, IBM will contract over 800 gigawatt-hours (GWh) per year of renewable electricity.

And IBM further committed to:

Reduce CO2 emissions associated with IBM’s energy consumption 35% by year-end 2020 against base year 2005 adjusted for acquisitions and divestitures.

To put this in context, in the energy conservation section of IBM’s 2013 corporate report, IBM reports that it sourced 17% of its electricity from renewable sources in 2013.

It is now committing to increase that from the 2013 figure of 17% to 20% by 2020. Hmmm.

IBM committed to purchasing 800 GWh’s of renewable electricity per year by 2020. How does that compare to some of its peers?

In 2014, the EPA reported that Intel purchased 3,102 GWh’s, of renewable electricity, and Microsoft purchased 2,488 GWh’s which, in both cases amounted to 100% of their total US electricity use.

In light of this, 800 GWh’s amounting to 20% of total electricity use looks a little under-ambitious.

On the other hand, at least IBM are doing something.

Amazon, as noted earlier, have steadfastly refused to do any reporting of their energy consumption, and their emissions. This may well be, at least in part, because Amazon doesn’t sell enough to the government to appear on the US Federal government’s Greenhouse Gas Management Scorecard for significant suppliers.

With the news this week that 2015 will likely be the hottest year on record, and that the Antarctic ice sheets are melting at unprecedented rates, it is time for organisations that can make a significant difference, to do so.

Google, purchased 32% of their total US energy from renewables in 2014. But more than that, this week it emerged that Google are considering moving climate denying sites down the list of Google search results.

And Dell have introduced AirCarbon, packaging for its products which is externally certified carbon negative.

These are the kinds of measures that can make a difference.

Come on IBM. If this were your Spring Break report card, it’d read “IBM – could work harder”.

post

Can we hack open source #cloud platforms to help reduce emissions?

RedMonk runs two conferences a year – Monki Gras in London in late January/early February and Monktoberfest in Portland, Maine in early October.

At this year’s Monktoberfest I gave a talk titled “Can we hack open source #cloud platforms to help reduce emissions?” to an audience which consisted almost entirely of developers and the feedback I received was consistently positive. The slides for the talk are above and I’ll post the video as soon as it is available, along with a transcription.

My presentation was fairly straightforward – it was a call to action. I first outlined the problem – most cloud computing companies are not publishing data around their energy or (more importantly) their emissions. Those that are, are not publishing it in enough detail, or are publishing the wrong data (carbon saved, as opposed to carbon emitted). I also pointed out that energy use is not a proxy for emissions – the amount of emissions the important metric to track.

Why don’t cloud computing companies disclose their emissions? It is probably a combination of not wanting to give away competitive intelligence, not wanting to be viewed as a polluter, and there being no agreed reporting standards around this area.

Then I pointed out a quick recap of the year 2012 to-date with all of the wildfires, floods, droughts, temperature records, and unprecedented ice loss in the arctic. I know these aren’t solely caused by cloud computing, but it is a significant contributor (estimates from Gartner in 2007 put the amount at 2% of global emissions – and that number is highly likely to have increased since then).

The solution – I proposed a fairly straightforward solution. Hack the currently available open source cloud platforms (Eucalyptus, CloudStack and OpenStack), write emissions measurement and reporting patches. Get the patches accepted back into the core so that when the next update of the software is pushed out, the companies using the three platforms will at a stroke, have energy and reporting capabilities. At that point customer demand should ensure that they make this info public (or at least available to their customers).

I concluded by noting that adding emissions metrics and reporting to cloud computing platforms will reduce emissions – and then asking the audience “Ok, so who’s up for it?”

During the Q&A, Andy Piper rightly pointed out that it would have been appropriate for me to mention the Cleanweb Manifesto in my talk and he was absolutely correct. Next time I give the talk I will point it out and urge people to sign it.

post

Employee engagement helps SAP’s carpooling initiative

I spoke with SAP’s Chief Sustainability Officer Peter Graf recently about some of SAP’s internal initiatives around reducing their carbon footprint. One of their biggest sources of emissions is company cars (22% of emissions in Q2 2012 – the only higher was business flights at 42%).

So SAP started a program to encourage car sharing called TwoGo. The program has an app which matches people who are driving to work, with those looking for a lift. It matches people based on common interests (and allows you to block people you don’t like!).

It allows you to track who’s the Greenest of your friends and it incentivises people by having allotted parking spots for car-poolers. Another nice incentive was that the money you saved from your carpooling could be donated to a charity of your choice – as Peter put it – “You could car pool for a cause”.

The slogan used within the company to promote carpooling wasn’t about saving the company money, or about saving the planet, it was “Make New Friends – Know the Gossip.” Even the CEO joined in.

At the time of the video above, SAP had created 20,000 car pools. It will be interesting to see how getting the employees engaged in this project will affect the 22% of emissions in Q2 that SAP had from company cars.

Full disclosure – SAP is an occasional client of GreenMonk’s video services.

post

GreenMonk TV Moderated Sustainability ScreenCast on Operational Risk Management with SAP’s Jeremiah Stone

As a new product for clients, GreenMonk are now offering moderated screencast videos – the inaugural one is with SAP’s VP of Sustainability Solutions, Jeremiah Stone. In this screencast Jeremiah and I discuss Operational Risk Management, what that has to do with sustainability, how SAP are moving from systems of record to systems of engagement, and seven minutes into the video, Jeremiah gets out his iPhone and iPad and gives a really cool demo of how their software can be used in the field.

Here’s the transcription of the screencast:

Tom Raftery: Hi everyone, welcome to GreenMonk TV. We are doing a moderated screen cast with Jeremiah Stone from SAP.

Jeremiah is VP, Sustainability Solutions. So today we are going to talking about operational risk management. Jeremiah could you first of all give me a quick intro on why you think operational risk management has anything to do with sustainability?

Jeremiah Stone: Hi Tom good morning. Thank you for having me on GreenMonk. I am a big follower and I like what you guys do. So it’s really a lot of fun for me to come on with you.

When SAP has worked with our customers, and we have a customer base in manufacturing of close to 30,000 customers, the common thing that comes back to us is that companies are engaged and interested in running more sustainably and that means using less energy, it means producing less emissions. It means recruiting people for the long term and making sure that they can adapt to changing labor conditions and changing demographics.

But there are sorta some prerequisites before people or companies can be successful with that and one of those is to cut operational losses and also to be able to adapt and change within their operations because often these factories, these plants, these operations are sort of steady state designed entities where they are very static and they are not really amenable to change.

Tom Raftery: What kind of operational losses you are referring to Jeremiah?

Jeremiah Stone: Well Tom it’s easy to think about the types of catastrophic accidents that happen throughout the world I think the Gulf oil spill is something that people think off, Bhopal thirty plus years on is still high in people’s minds. So those sorts of process safety incidents, we regrettably had a fire here in the California Bay Area not two weeks ago up at the Richmond Refinery.

These things happens, sort of, every day and what we are seeing is that as manufacturing operations and manufacturing I think of oil and gas, I think of utilities, I think of mining, but even transportation logistics air planes that sort of thing. We’ve built these systems that are very complex and sophisticated but they are not very change friendly.

So, to change them, they need to change, they need a radical change for sustainability purposes they need to have systems in place whereby you can change and continuously improve the static designed system whether it’s an energy refinery or a transportation network without having accidents, without hurting people, without creating environmental spills, et cetera. And we find that our customers are fundamentally lacking that ability.

Tom Raftery: Okay, tell me something so about or — tell me about this operational risk management solution that SAP have.

Jeremiah Stone: Okay, well maybe first we can start with what we just talked about and saying that what our customers are asking us for.

Our customers are asking us to help them innovate their operations and become more sustainable and really what that has boiled down to when you dig into it with customers is that they typically have environment health and safety management programs.

However, they really run at an individual operational entity level and so it is difficult to compare different factories, it’s difficult to compare different operations, and it’s very difficult to get proactive and move beyond very reactive, “oh no an incident happened how do we deal with that?” setting. But rather identifying risk before it turns into an incident and dealing with it.

You cannot remove risk from these operations but you can manage them. And that’s really what our customers are asking us for. And when we — we’ve gone out and we’ve worked with I think close to 50 co-innovation customers now and working with means going with our teams into their operations interviewing people throughout the company and determining what the problems are and where software can help.

What we found consistently is that it’s an information flow problem. It’s an information flow from the corporate level where the purse strings are, the ability to spend money down to the individual level and some of the problems we find is that there is a really strong and meaningful commitment to safety at the corporate level in the boardroom, however it’s very difficult to understand where to spend the money, because you have this very large sophisticated operations and it’s difficult to know where to make the investment and getting beyond a better laminated sign on the chain link fence outside the operation is tough.

And then when you get to the operational level oh gosh, every — these days margins are razor thin, the current economic situation most of your line level management or leaders are really focused on hitting outcomes, hitting on, hitting their targets. And they may be in a position to make bad decisions, here we say can we put in a bigger pump to increase production, well if you put in a bigger pump how do you know that in your, in your facility that’s not going to burst a seal somewhere?

That’s really standard process safety management, but doing that in a consistent repeatable way successfully is rather difficult and then at the individual worker level understanding the operational environment in knowing how to behave, take the right processes, be safe is a challenge, but we are completely missing the inbound engagement conduit if you will, when they see something wrong how can one, an individual worker if they see something wrong report that.

All to often, when there is a problem and we do an investigation after an incident, well gosh the workers who are in that environment knew that there was something wrong, they didn’t have a means to communicate.

Tom Raftery: Okay, so how do you fix that?

Jeremiah Stone: Well there is a lot of discussion these days in the enterprise software community moving from systems of record to systems of engagement and this is something we focused quite a bit on and I like to show you a couple of applications right now where we are taking what would be a typical approach to a system of record to identifying a risk, which would be sort of one of SAP’s typical enterprise applications at a specialist enterprise health and — environment health and safety management professional level and moving that both directions.

And so if we look at this you could imagine that you are going to have your EHS professionals that are site level managers but they are the only ones that really have that information today and they don’t have a means by which they can push that information up to corporate nor do they have a means where they can gather at large scale that information from the workers.

And what I’d like to do is that I’d like to show you how we are addressing that today in terms of a mobile application. So I am going to share with you now my iPhone. Hopefully this, comes through, can you see my iPhone?

Tom Raftery: Yep.

Jeremiah Stone: Okay, so what I’d like to do is I’d like to show you our safety issue application. Our safety issue application, let me back out of here, this is the entire application and so we are trying to really take a note out of consumer design and have one screen application without lots of tabs and drill through menus. And we have designed this application around the, “if you see something, say something” design principle and actually John Astill one of the mentors has worked on this app, that’s part of his sustainability activities.

And I’ve got a example here, I raided my son’s toy chest this morning, and just to give you an example here. You can imagine here is our little repairman out in the setting. And he notices there is something wrong with this hauler. Rather than walking all the way back to the shop, he can simply take a picture of what’s wrong with the hauler. He can say okay, I am going to use that photo, he can press the record button here and record description of what’s wrong, I am not going hit that record button because then you loose the screencast. Maybe enter quick description here, “Axle wearing too quickly on hauler,” accept that description and then simply submit the safety issue.

And so you can see there that in a few seconds we have gone from seeing something wrong, recording a description with audio and then and then sending that off to the safety experts and this is uploading like it would to YouTube or anything else. And what you haven’t seen me do is enter my name, or enter where I was, or any of those such things because we are using location based services, we are using the enterprise backbone to say who saw the thing that was wrong, where are they, et cetera.

And because we also have the entire asset infrastructure in the background, we can similarly then say, oh well actually we know which truck that was, because we have near field communications et cetera. So that’s how you get more information into the system.

Tom Raftery: But nobody ever reads these reports, do they?

Jeremiah Stone: That’s an interesting point. Now imagine you are in this world where you drop the hey I saw something wrong into the box on the wall or you submit that paper issue, how do you know what happened if you were the person that reported that. I am glad you asked that because as you can see here we have the ability to capture the safety issue, but we also have this button here that says my issues.

So if I click into that my issues what’s it’s going to do is it’s going to look for every issue that I have submitted. And I can drill in, and I can see the real time status on that issue and if it’s being worked on or not. So now I am creating mutual accountability with the safety organization, you say nobody every reads that, well guess what, you would actually know if anybody had ever, ever read it, because we are tied into the core SAP system in the background.

And now there has been a workflow sent to the responsible safety mentor and we are are using that enterprise backbone now to facilitate communication.

So, now, rather than dropping that paper form off or submitting a form, it just goes into somebody’s inbox, now we are using much, much the same in any kind of social media. We are using mobility and social media now to push that information to the responsible safety person and along with a GPS of where we are, okay it’s not picking up, but well I think I must be in my Faraday shielded office here. But, this would then be picking up my my GPS, it would also be passing out through to the application. So now the safety manager and the employee have a relationship driven by the application.

Tom Raftery: But now the safety manager has gone from receiving one notification every three months to receiving 300 everyday.

Jeremiah Stone: That’s correct.

Tom Raftery: How does he work with that or she?

Jeremiah Stone: Well I’m not going to drill into that right now, but that’s the thing we’ve always been really good at, at SAP is how to deal with the large volumes of data. And so we have the ability to sort, slice and dice this information coming in, we have heavy duty analytics to show trending, to hot spot on the basis of the information put in. We also have as you see here this little flag, immediate action required, yes or no to help to raise it or lower the priority.

And our safety manager tells us hey that’s okay, my problem in the past was really a lack of data, not too much data and I want more data. There is a well known, in the industr,y sort of a ratio between near misses to incidents, its about 300 to 1, about 300 observations or near misses to an individual incident. And if you actually go into the day to day — any of these companies and they say, oh you know, we had 100 reportable incidents but we had 6,000 reported near misses.

Well they are usually quarter, a couple of orders of magnitude off between an observation or near miss and an actual incident. And so these professionals actually want more data not less.

Tom Raftery: Cool.

Jeremiah Stone: And we give them the tools to deal with that data, but now I’m going to show you how we expose that data to people who aren’t used to dealing with that data and that’s that upper level of management that I talked about before.

So that upper level of management, who is not giving any data at all, if we were to throw 300 observations at them per day, they wouldn’t have any idea what to do with it. But if we take those people who are good at dealing with the area and we expose the output of their analysis to upper management in a mobile device as you see here in a way that they can consume it, we can get better investments.

So what you’re seeing now is incident root causes and so somebody would have entered a safety observation with the iPhone app on the left and then there is a safety professional in between who has processed that, done an investigation, identified root causes.

Now we have the ability, let’s say your upper management are rather visual learners, I can drill in here to a word cloud and rather than looking at this with boxes and rows et cetera, we can expose the root causes to management or other users, let’s say you’ve got people coming into the organization now that are not used to looking at spreadsheets their whole life but they are used looking at Tag clouds or something that you get online and we can give them their information in a way they can consume it.

And so here we can see okay we’ve got a training problem, but let’s just say for the sake of argument that we’ve got a non-millennial here looking for the root causes and they want to look at a pie graph and then they want to say okay well I understand the root cause, but I understand what injuries have been happening.

So I’m going to add another dimension here, so now I’ve taken my route causes along the bottom here; defective equipment, lack of training, we still see that spike on lack of training that we saw before but now we’ve added that body part that’s been injured and now I’m just going to sort by occurrences.

So now we can see we’ve got a — main root cause is lack of training and we have arm injuries. And so the probability here is that we’ve got new equipment, we can dig a little bit further, we probably have new equipment in the setting and people are getting hurt by that.

We talk about environmental spills, we talk about explosions but big problem with sustainability is it’s also how you’re treating your labor force and the long-term consequences of what we maybe perceiving as smaller incidents, but let me tell you if you lose a finger, you lose an arm that’s a catastrophic incident to you as a worker.

So, we want to be able to help with that as well, and also from an employer point of view, your long-term liabilities with regard to workers compensation, et cetera, and what’s great about this app is we know that managers work in primary in email, well I can now send this to let’s say my safety manager, update training and go ahead and send that off and I can go ahead and you know I’m really amazed I should have you in there.

Well and anyway I can send that off to you Raftery at Greenmonk or whatever and then what this would give you is all of the data but also that graphic and say okay let’s look at this data I’m looking at, let’s work on this together.

So we’re really trying to move from what would have been a system of record approach to safety and risk, to a system of engagement approach by pushing out the ability to identify risks, here we can see we can take a picture there, the ability to identify risks in the operational setting and also the ability to understand what those risks are and take action at the management level.

Tom Raftery: And what kinds of industries would typically be interested in solutions like this?

Jeremiah Stone: So that the types of industries we tend to work with in solutions like this tend to be what we refer to as asset intensity industries, so these are industries that have lots of trucks, planes and also large equipment and they are high risk. So you typically think of oil and gas, both upstream on the exploration and production side and downstream on the refining side.

Also think of any type of large construction, so we’re staying in the energy field here, you could do a thing of utilities, what some people refer to as large construction companies with generation capacity. And anybody who is going to be putting up say a windmill farm or solar, et cetera, it’s going to be a same challenge here in terms of people in it and with lots of stuffs moving in, lots of heavy machinery, mining, mill, production.

I mentioned utilities, that also would include utilities like phone, et cetera and then transportation logistics, think of your airlines, US, FedEx, US Post that sort of thing. There is definitely a large demand in those types of industries for this, because they are large far flung organizations where training is a big deal, they are very fast moving and risk is also a big deal and so you see the potential to have major issues there.

Tom Raftery: And what about the current economic climate, is that impacting on sales?

Jeremiah Stone: I’d say it’s driving sales even more quickly. We’re seeing in this portfolio about a 35% compound annual growth rate over the last three years since the crisis onward, and that’s because companies are becoming even more loss averse in the current environment.

So it works both ways, when you’re trying to grow and you are investing you don’t want to have incidents because you want to be fast and agile to market, but also when you’re concerned about potential production stoppages or issues with regards to your liability, say an environmental spill or people spill or people incident, you want to control that as well, and so it’s really a cycle proof investment area in that sense, because it’s both something you need when you’re growing quickly and investing and something when you are at more of a steady state and you’re looking to control loss.

Tom Raftery: We are coming on time to wrap up now, just one last thing, where do you see things going from here?

Jeremiah Stone: Well what we’ve done today is we’ve taken our portfolio as we have it and as I mentioned we have these base capabilities in your incident management risk assessments, workers safety management, management changed and we’ve moved these into more systems of engagement at both the individual worker level and the corporate level.

Where I believe we are is we barely built the foundation for what we can do here, and the next step will be utilizing our abilities to deal with big real time data and so not just having the intelligent sensor of the human pushing data in, but imagine the internet of things pushing information into a system like this and then imagine taking predictive analytics and start to not only identify a risk when we see it from a professional point of view but now put algorithms at that.

Let’s point R at that from a particular algorithm point of view and start to identify latent and hidden risk in our operations. We can have predictive safety as well and then just have to utilize our assets as well in the cloud, so for example the recent success factors, acquisition, you’ll notice something that you don’t see on the screen here is training, qualifications, ongoing learning, informal learning via collaboration.

The true moving the system engagement, we should be utilizing Jam here from SAP to help grow communities of practice and communities of expertise around safety across companies and across even value chains and we’re starting to see that as well, so I think we’ve really barely taken the first step with what we can do here.

Tom Raftery: Well, fascinating. Jeremiah that’s been great. Thanks a million for talking to us today.

Jeremiah Stone: Thank you so much Tom. Bye, bye.

post

Use open source platforms to find cloud computing’s energy and emissions footprint

Dials

Regular GreenMonk readers will be very aware that I am deeply skeptical about claims that Cloud Computing is Green (or even energy efficient). And that I talk about the significant carbon, water and biodiversity effects cloud computing can have.

One of the biggest issues with any claims of Cloud Computing being energy efficient, or Green, is the lack of transparency from the Cloud Computing providers. None Almost none of them are publishing any data around the energy consumption, or emissions of their Cloud infrastructure (article updated from “None of them” to “Almost none of them…” after comments from Memset and Greenqloud in the comments section below). Without data to back them up, any claims of Cloud computing being efficient are worthless.

Last week, while at the RackSpace EMEA Analyst day, we were given a potted history of OpenStack, RackSpace’s Cloud Computing platform. OpenStack was jointly developed by NASA and RackSpace and they open-sourced it with an Apache License in July 2010.

Anyone can download OpenStack and use it to create and host Cloud Computing solutions. Prominent OpenStack users include NASA, RackSpace (not surprisingly), AT&T, Deutsche Telecom, HP and IBM.

What has this got to do with Cloud Computing and energy efficiency I hear you ask?

Well, it occurred to me, during the analyst day, that because OpenStack is open source, anyone can fork it and write a version with built-in energy and emissions reporting. What would be really cool is, if this functionality, having been written, became a part of the core distribution – then anyone deploying OpenStack, would have this functionality by default.

And, OpenStack isn’t the only open source Cloud platform – there are two others that I’m aware of – Citrix’s CloudStack and Eucalyptus. Having the software written for one open-source platform, should allow reasonably easy porting to the other two.

Of course, with the software written as open-source, there could be constant improvement of it. And as part of one of the cloud platforms, it should achieve widespread distribution quickly.

Having energy and emissions information available, will also allow inefficiencies in Cloud infrastructure to be quickly identified and fixed.

So, the next step is to get someone to write the software – anyone up for it?

Or, what are the chances of getting someone like HP, IBM, RackSpace, or even NASA to sponsor a hackathon whose aim is to develop such software?

Photo Credit Jeremy Burgin

post

Do you want to influence EU policy on green cloud computing?

Cloud

European policymakers are reaching out to ask European citizens for their help in crafting legislation for the better of all its citizens. This is a nice departure from the lobbytocracy which exists in some countries.

Currently, as part of the Digital Agenda for Europe, there is a process in place called the Digital Agenda Assembly which has a call for discussion and feedback on a number of hot IT issues such as Cloud, Data, Security, and Social Media.

Anyone can sign up at the site and contribute.

Via Paul Miller I came across a discussion on Green Cloud, which regular readers here will recognise as an issue I have an interest in.

The Cloud group moderator posted the following question:

The recent report by Greanpeace [sic] (http://www.greenpeace.org/international/Global/international/publications/climate/2012/iCoal/HowCleanisYourCloud.pdf) cast a light on importance of energy efficiency and use of renewable energy sources for cloud environments and data centers.

Should policy address such issues in future EU cloud strategy and how ensure a green and sustainable cloud development?

Your ideas on this subject are more than welcome.

Wow – an opportunity to influence EU policy and possibly make cloud computing more Green – I couldn’t resist. I posted the following response:

Greenpeace are correct – data centers are using dirty power to run their clouds.

Unfortunately this is often outside their control – especially in the US where the utility companies are regional monopolies and there is no choice in energy provider.

In the EU, there is more competition, and data centers should be encouraged to use energy from renewable sources and to site new builds where renewables are available. The greater the demand for renewable energy, the more will be built out.

I think the best way to encourage this is through transparency. Data centres need to be required to report fully and regularly their complete energy and emissions.

Iceland is currently running one of the world’s most reliable energy grids (it doesn’t have any outages). As well as being highly reliable, it has the cheapest energy in the western world and it is 100% renewable.

Iceland is due to become a full member of the EU in the coming year – so that should help the EU in attracting cloud providers looking for a renewable energy source.

But that is quite a local solution.

The real requirement is to move our all energy generation away from fossil fuels as soon as possible – this is important not just for cloud computing, but for every aspect of our life.

As Paul says above, mandating data centres to use Green power is not an answer, moving our generation to renewables (and requiring full transparency and reporting from data centres) is.

So there you have it – my recipe for making Cloud computing Green is to require full (auditable) reporting from all data centres (and every significant energy consumer, why stop at data centres?) of the entirety of their energy and emissions. This will create a significant demand for more renewable energy, leading the generators to re-double their efforts to bring more renewables resources on-line and rewarding those who have already done so.

So if you want to influence EU policy on cloud computing to make it more Green, why not head over to the Green Cloud discussion at the Digital Agenda and let your voice be heard too?

Photo Credit supertin

post

SAP’s 2011 Sustainability Report

SAP 2011 Sustainability Report

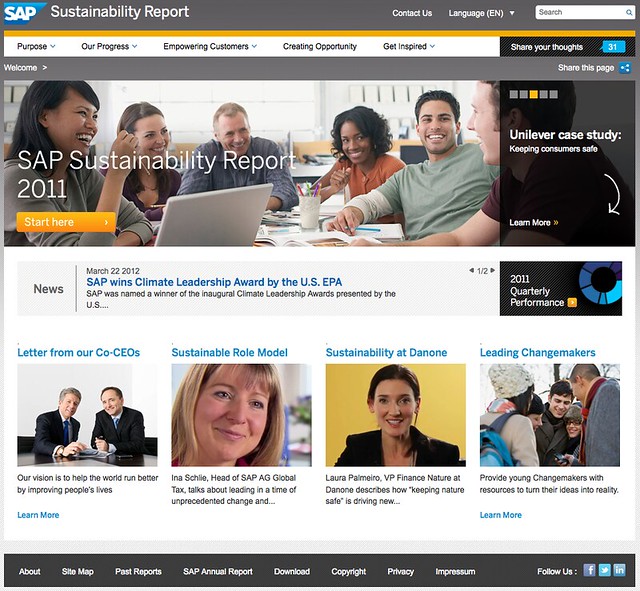
SAP launched its 2011 Sustainability Report this week and in terms of aesthetics and social sharing, this is one of the best Sustainability Reports I have seen to-date.

The site contains many videos with SAP staff – including one from co-CEO’s Jim Hagemann Snabe & Bill McDermott which is featured prominently on the home page. Interestingly there are also several customer reference videos as well with the customers vouching for how SAP have helped them become more sustainable.

There are also many blog posts and interesting stories from SAP employees talking about everything from Materiality, through to Electric Vehicles.

There is a whole section in the report dedicated to how SAP Empowers its customers. It includes customer video testimonials, white papers and some very impressive top line figures for savings (“5.7 million tons of estimated carbon reductions, saving $550 million in energy costs”). However the methodology for producing these data is not gone into in any detail in this section. I contacted SAP to voice my concerns about this and they assured me that in the next couple of weeks the report will be updated to include the methodologies, and the story around producing this innovative section of the report.

SAP's progress on sustainability

As you’d expect from SAP, there’s also a lot of data in the report on how they are doing on their journey to sustainability and it’s mostly positive results. Almost all of their numbers are headed in the right direction. Unfortunately the exceptions to this are in the environmental area with increases in Data Centre Energy, Total Energy consumed and SAP’s Greenhouse Gas Footprint.

On the data centre energy front, the energy increase is both in real terms, and in kWh per employee. This is likely due to SAP increasingly hosting customers data and applications through their cloud offerings. What might be interesting here would be to see a kWh per cloud customer metric, or similar. Also, one would suspect that there should be a net reduction in energy consumption for that application, if it is replacing a customer’s pre-existing on-premises application. There could be some interesting data to mine there around energy wins.

On the Total Energy Consumed page you see that energy consumption has increased from 843GWh in 2010 to 860GWh in 2011. In the report it attributes this to growth in the business (SAP bought SucessFactors during this period) but the lack of a kWh per Employee metric on this page makes this hard to verify.

On the Greenhouse Gas page, we again see an increase in emissions from the 453kTons 2010 figure to 490kTons in 2011. On this page, it is possible to see a By Employee figure and here too we see an increase in emissions from 8.7 tons per employee in 2010 to 9.0 tons in 2011. However, when we look at the emissions by ? revenue, we see a fall, from 36.3g/? in 2010 to 34.4g/? in 2011. 2011 was a good year for SAP, from a revenue perspective, it would appear.

On the upside, SAP has increased its use of renewable energy from 45% to 47%. Not a huge increase, to be sure, but at least this environmental metric is going in the right direction.

I mentioned that the site has a lot of social sharing built into it – there’s a “Share this page” on every page which allows you to share that page on your social network of choice (or print, or email!). However, in terms of interactivity, the report seems to have regressed. In the 2010 report, there was the ability to comment directly on any page, to rate comments, and see conversations taking place about the page, directly on the page. This functionality has been removed completely from the 2011 report, and to be honest, the report is the poorer for its removal. Browsing other readers comments on pages is always a superb way to gain others insights into the page content – both for consumers of the report, as well as for SAP.

From a UI perspective there are several glitches on the site (some rollovers not working; external links and links to PDF’s not made obvious; and inconsistent use of pretty permalinks etc.) but these are minor quibbles and easily fixed.

The 2010 report doubled individual visitors over the 2009 report, with the 2010 report receiving over 60,000 readers. SAP tell me they are aiming to maintain that progress and have over 120,000 visitors to this, the 2011 report. One huge advantage of having the report in the form of a website, is of course the invaluable data stream you receive from the visitor analytics to the report. Something which is impossible to achieve with a PDF.

On the whole, SAP’s 2011 report, with the removal of the interactivity and the increased energy and emissions, seems to have faltered slightly in terms of the tremendous progress it had been making to-date. To put that in perspective, SAP’s 2011 report is still one of the better produced sustainability reports.

For the 2011 report I’ll have to grade it as “very good, but could do better”.

Photo Credit Tom Raftery

post

Honda Insight vs Toyota Prius

Honda Insight dashboard

Toyota Prius dashboard

So I gave back the loaner Insight to Honda yesterday. Honestly, I was sorry to see it go.

Here are my impressions of the Insight divided into my likes and dislikes and most are direct comparisons with my current car, a Toyota Prius. Realise I am no motoring expert and these are extremely subjective opinions!

Likes:

  • The Insight is quite a bit more responsive than the Prius
  • It has a lot better external visibility, especially rearward and the two side mirrors are very generously sized
  • The driver’s seat gives very good lumbar support
  • The radio sounds a lot better (more bass, less tinny) than the Prius

Dislikes:

  • The dashboard in the Insight is very confusing and hard to read information from. Honda could definitely do with some input from usability experts here. The dashboard in the Prius is far easier to find information from as you drive
  • There is significantly less rear passenger legroom in the Insight
  • Although the emissions figures for the Insight are roughly similar to the Prius (101-105g CO2/km), it is slightly less fuel efficient (I got 5.5l/100km (46.12mpg US) in the Insight compared to 5.1l/100km (42.77mpg US) for the Prius)
  • The one button for Eco Mode means it is not possible to control the EV mode as easily as with the Prius – this is important as there are times driving the Prius I want to be in EV mode for fuel economy reasons

Other opinions –

  • My wife found the Insight passenger seat too hard for her taste (the lumbar support I liked!)
  • My six year old didn’t like that his seat belt was harder to close in the Insight (seats might be narrower and thus booster partially covers seatbelt buckle)
  • My three year old liked the flowers on the side of the loaner Insight Honda gave me!!!

The bottom line for the Insight is that it is a nice drive. It is about ?3,000 cheaper than the Prius to buy in Andalucia (depending on options you are looking at ?18k for the basic Insight vs ?21k for the basic Prius). This biggest issue I had with the Insight was the dashboard but if I could save ?3,000 on the purchase price without sacrificing on emissions, I’d put up with poor information display.

post

Save Toms not Tonnes!

At the recent it@cork Green IT conference Gavin Starks of AMEE had an idea which he and Simon Wardley co-pitched to the audience, to change the carbon footprint metric from tonnes of CO2 to people!

The idea, as outlined in the video above was so well received that we decided to create a site to promote it and encourage anyone who also thinks it is a good idea to become involved. The site is at megatom.ning.com.

From the MegaTom about page:

The average European creates 10 tonnes of CO2 per annum.

The average American, 20 tonnes.

To avert the dangers of Climate Change, we need to drop our CO2 production to 1 tonne per person.

Problem: What is 1 tonne of CO2? How do you visualise it?

Answer: You don’t! You change the metric. 1 tonne = 1 person’s annual CO2 production.
1 average person. 1 Tom.

Because it’s not about saving tonnes, it’s about saving everyone.

For example, a 15 minute shower is 0.1% of a Tom, driving 100 miles in a standard car is 4% of a Tom and producing 1 laptop computer is 45% of a Tom.

How many Toms have you consumed? Don’t waste your Toms.

Save Toms, not tonnes!

If you agree that we should be saving Tom’s, not tonnes, why not go to the MegaTom, join and please leave any feedback/suggestions. Thanks.

post

Schwarzenegger sends “a strong message” to the federal govt

Arnold Schwarzenegger
Photo Credit Thomas Hawk

I see Grist reporting that the US’ first Cap and Trade program went live. Power plant owners in 10 Northeastern states had to submit sealed bids in order to emit greenhouse gases yesterday.

Then the New York Times has a story about an alliance of 7 Western States and 4 Canadian provinces who have come together under the name Western Climate Initiative to also put a Cap and Trade system in place.

While the WCI draft plan doesn’t come into effect until 2012, the Northeastern states is now live! It only requires a 10 percent reduction in emissions by 2019 and that only in emissions generated by power plants but it is better than nothing and it sets a precedent.

And, as Gov. Arnold Schwarzenegger said

We’re sending a strong message to our federal governments that states and provinces are moving forward in the absence of federal action, and we’re setting the stage for national programs that are just as aggressive.

More aggressive, I hope – looks like politics has seriously diminished the “Terminator’s” definition of aggressive!