post

Cloud Computing: Google Apps cloud has a relatively high carbon intensity

Cloud

I have been researching and publishing on Cloud Computing for quite some time here. Specifically, I’ve been highlighting how it is not possible to know if Cloud computing is truly sustainable because none of the significant Cloud providers are publishing sufficient data about their energy consumption, carbon emissions and water use. It is not enough to simply state total power consumed, because different power sources can be more, or less sustainable – a data center run primarily on renewables is far less carbon intensive than one that relies on power from an energy supplier relying on coal burning power stations.

At Greenmonk we believe it’s important to get behind the headline numbers to work out what’s really going on. We feel it’s unacceptable to simply state that Cloud is green and leave it at that, which is why we’ve been somewhat disappointed by recent work in the field by the Carbon Disclosure Project. We would like to see more rigour applied by CDP in its carbon analytics.

Carbon intensity should be a key measure, and we need to start buying power from the right source, not just the cheapest source.

I was pleasantly surprised then yesterday when I heard that Google had published a case study ostensibly proving that Cloud had reduced the carbon footprint of at least one major account.

However, it is never that straightforward, is it?

The Google announcement came in the form of a blog post titled Energy Efficiency in the Cloud, written by Google’s SVP for Technical Infrastructure, Urs Hölzle. I know Urs, I’ve met him a couple of times, he’s a good guy.

Unfortunately, in his posting he heavily references the Carbon Disclosure Project’s flawed report on Cloud Computing, somewhat lessening the impact of his argument.

Urs claims that in a rollout of Google Apps for Government for the US General Services Administration,

the GSA was able to reduce server energy consumption by nearly 90% and carbon emissions by 85%.

An 85% reduction in carbon emissions sounds very impressive – but how does Google calculate that figure? Also worth considering is the age of the server estate – any data center that decommissions older servers in favour of new ones is likely to see an efficiency bump. Assuming the GSA servers running Microsoft apps were more than five years old, they would have seen a considerable efficiency bump simply by running the apps on new servers, on premise or off. Without disappearing down a rathole, its also worth noting cradle to cradle factors in server manufacturing – supply chains consume carbon.

We looked at a whitepaper titled Google Apps: Energy Efficiency in the Cloud [PDF], where the search company shares some of the methodology behind the blog post. We would like to see a lot more detail about assumptions and methods.

The key reference to how Google calculated carbon emissions is this line:
The following summary tallies up every GSA server dedicated to email and collaboration across 14 locations in the continental U.S. and applies the appropriate PUEs, electricity prices, and carbon intensities for each location

Here’s the table:
Google Apps GSA case study

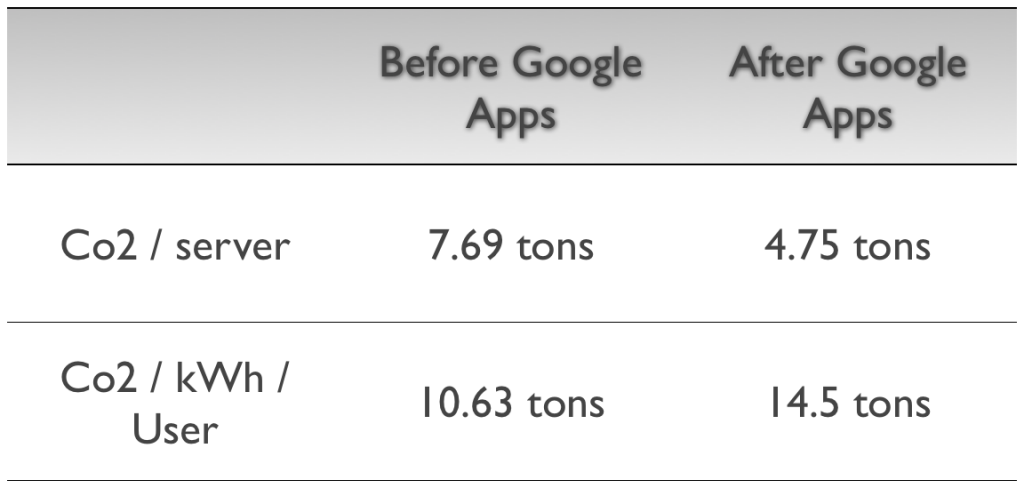
The data in the table above is interesting but if you look at the carbon information, you start to notice something strange – here’s a slightly different view on Google’s data:
Google Apps carbon intensity

While it is no real surprise that Google’s servers produce less CO2 per annum than the GSA’s (4.75 vs 7.69 tons), what is very surprising (to me at least) is the fact that Google’s facilities are significantly more carbon intensive than the GSA’s were (14.5 vs 10.63 tons of CO2 per kWh).

In simple terms, carbon intensity is a measure of the amount of CO2 released in the generation of electricity. The data above, clearly show that the data centres hosting the Google Apps Cloud are not optimised for reduced emissions (the best way for data centers to optimise for reduced emissions is to source electricity generated from renewable sources).

I guess the good news is that, while Google has helped the GSA to reduce its carbon emissions, there’s plenty of room for improvement!

I reached out to Urs for a response to this and because he’s traveling at the minute, the only answer I received pointed out that since 2007 Google’s net emissions are zero. And, in fairness to Google, they do fund some worthwhile offsetting projects, as you can see in the video below (check out the farmer towards the end, he’s just awesome!).

Cloud photo credit mnsc

post

SAP’s Sustainability announcements at Sapphire Now

SAP co-CEO Jim Hagemann Snabe at Sapphire Now 2012

SAP co-CEO Jim Hagemann Snabe at Sapphire Now 2012

Technology innovation plays a major part in creating a sustainable world tomorrow

So said SAP co-CEO Jim Hagemann Snabe at this year’s SAP Sapphire Now conference in Orlando. He then went on to predict three major trends in computing for the coming years – according to Jim, in the next five years everything will move to Cloud, everything will be in main memory and everything will be mobile.

This wasn’t just some off-the-cuff remark – these three developments are core to SAP’s product roadmap – even in the Sustainability space.

In the mobile space for example, at Sapphire Now SAP announced a new version of a mobile app for incident management. With this app, workers can now log issues from their mobile device with a photo or video, as well as an audio recording, and send it directly to an incident or safety manager for corrective action. This crowd-sourcing of safety information also has built-in tracking of the reported incident which is hugely empowering for workers who may previously have felt their voice wasn’t heard. And for the companies deploying this solution it leads to a safer work environment and a happier workforce.

This puts me in mind of an initiative IBM rolled out with the Los Angeles Unified School District (LAUSD) where they enabled students, teachers and staff to report issues like water leaks, broken aircon/heating, exposed cables and so on, by sending text messages and photos through their mobile phones. More please.

Also in the mobile sustainability space, SAP have their Electronic Medical Record app [SilverLight warning] – an app which gives doctors instant access to a patient’s electronic medical records.

In the Cloud space, SAP have made two major recent acquisitions – Successfactors and more recently Ariba at a cost of roughly $7.7bn. This is a clear indicator that while SAP maybe late to the party, it is serious about catching up.

And in the Sustainability space? Well SAP’s carbon management software, Carbon Impact OnDemand is already Cloud delivered. At SapphireNow SAP announced that they are going to rollout an on-demand service for product safety that the company is calling the SAP Product Stewardship and Safety Network. This will be a network where safety professionals can share safety information and best practices.

The irony of sustainability-related software being delivered via the Cloud, a technology which is not Green at all, is not lost on me. It does appear to be lost on SAP however – more on which in a follow-up post.

And finally in-memory computing – what is it? Well, you know how information held in RAM is much faster to access than information on disk, right? So HANA, SAP’s new in-memory database, is where the database is held in RAM for much faster data access. Also, in-memory databases can hold enormous quantities of data, and query them in milliseconds. This is a huge step forward in database technologies and according to SAP it will vastly simplify database maintenance as well because there should no longer be a need for large data warehouses.

Where do the HANA and Sustainability stories intersect? There are several examples – the first is in the area of Smart Grids and Smart meters. The volumes of information utility companies will be expected to handle after installing smart meters are orders of magnitude greater than anything they are used to. Realtime analysis of this firehose of information will allow for much better demand-side management, matching the demand curve to the supply curve, stabilising the grid and allowing for greater penetration of variable generators like wind and solar. Also, this availability of highly granular energy consumption data will facilitate the development of all kinds of new energy products and services that would have previously been impossible to offer. This is sorely needed by utilities who are in the uncomfortable position of currently (no pun) having to try to convince customers to buy less of their product.

Other use interesting cases are discussed in a great post on How Big Data Will Help Achieve Sustainability Goals by SAP’s Scott Bolick. And when you finish checking that out, head on over to Jennifer Lankheim’s post on SAP Situational Awareness for Public Sector where she discusses this new SAP Rapid Deployment Solution to help public safety and security organizations better anticipate, assess, and act on emergency situations.

We are only scratching the surface of what the implications of Big Data, Cloud, Mobility and in-memory computing are for sustainability. Expect to see far more announcements in this space in the near future.

Disclosure – SAP is a GreenMonk client and SAP paid my travel and expenses to attend Sapphire Now.

Photo Credit Tom Raftery

post

Do you want to influence EU policy on green cloud computing?

Cloud

European policymakers are reaching out to ask European citizens for their help in crafting legislation for the better of all its citizens. This is a nice departure from the lobbytocracy which exists in some countries.

Currently, as part of the Digital Agenda for Europe, there is a process in place called the Digital Agenda Assembly which has a call for discussion and feedback on a number of hot IT issues such as Cloud, Data, Security, and Social Media.

Anyone can sign up at the site and contribute.

Via Paul Miller I came across a discussion on Green Cloud, which regular readers here will recognise as an issue I have an interest in.

The Cloud group moderator posted the following question:

The recent report by Greanpeace [sic] (http://www.greenpeace.org/international/Global/international/publications/climate/2012/iCoal/HowCleanisYourCloud.pdf) cast a light on importance of energy efficiency and use of renewable energy sources for cloud environments and data centers.

Should policy address such issues in future EU cloud strategy and how ensure a green and sustainable cloud development?

Your ideas on this subject are more than welcome.

Wow – an opportunity to influence EU policy and possibly make cloud computing more Green – I couldn’t resist. I posted the following response:

Greenpeace are correct – data centers are using dirty power to run their clouds.

Unfortunately this is often outside their control – especially in the US where the utility companies are regional monopolies and there is no choice in energy provider.

In the EU, there is more competition, and data centers should be encouraged to use energy from renewable sources and to site new builds where renewables are available. The greater the demand for renewable energy, the more will be built out.

I think the best way to encourage this is through transparency. Data centres need to be required to report fully and regularly their complete energy and emissions.

Iceland is currently running one of the world’s most reliable energy grids (it doesn’t have any outages). As well as being highly reliable, it has the cheapest energy in the western world and it is 100% renewable.

Iceland is due to become a full member of the EU in the coming year – so that should help the EU in attracting cloud providers looking for a renewable energy source.

But that is quite a local solution.

The real requirement is to move our all energy generation away from fossil fuels as soon as possible – this is important not just for cloud computing, but for every aspect of our life.

As Paul says above, mandating data centres to use Green power is not an answer, moving our generation to renewables (and requiring full transparency and reporting from data centres) is.

So there you have it – my recipe for making Cloud computing Green is to require full (auditable) reporting from all data centres (and every significant energy consumer, why stop at data centres?) of the entirety of their energy and emissions. This will create a significant demand for more renewable energy, leading the generators to re-double their efforts to bring more renewables resources on-line and rewarding those who have already done so.

So if you want to influence EU policy on cloud computing to make it more Green, why not head over to the Green Cloud discussion at the Digital Agenda and let your voice be heard too?

Photo Credit supertin

post

SAP’s 2011 Sustainability Report

SAP 2011 Sustainability Report

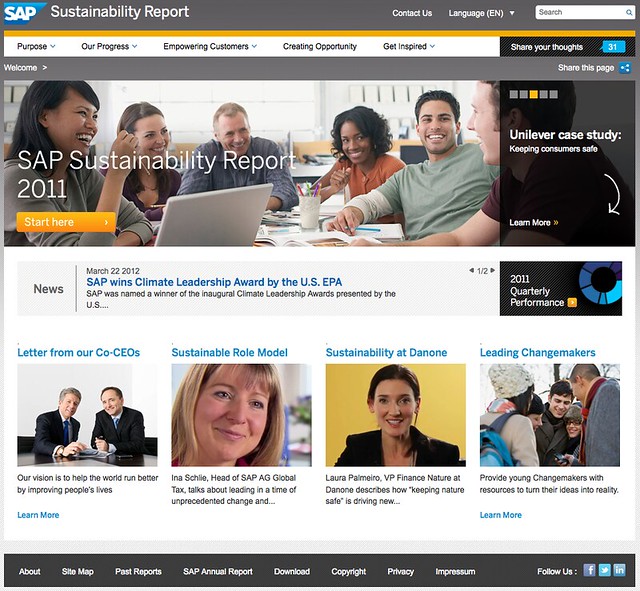
SAP launched its 2011 Sustainability Report this week and in terms of aesthetics and social sharing, this is one of the best Sustainability Reports I have seen to-date.

The site contains many videos with SAP staff – including one from co-CEO’s Jim Hagemann Snabe & Bill McDermott which is featured prominently on the home page. Interestingly there are also several customer reference videos as well with the customers vouching for how SAP have helped them become more sustainable.

There are also many blog posts and interesting stories from SAP employees talking about everything from Materiality, through to Electric Vehicles.

There is a whole section in the report dedicated to how SAP Empowers its customers. It includes customer video testimonials, white papers and some very impressive top line figures for savings (“5.7 million tons of estimated carbon reductions, saving $550 million in energy costs”). However the methodology for producing these data is not gone into in any detail in this section. I contacted SAP to voice my concerns about this and they assured me that in the next couple of weeks the report will be updated to include the methodologies, and the story around producing this innovative section of the report.

SAP's progress on sustainability

As you’d expect from SAP, there’s also a lot of data in the report on how they are doing on their journey to sustainability and it’s mostly positive results. Almost all of their numbers are headed in the right direction. Unfortunately the exceptions to this are in the environmental area with increases in Data Centre Energy, Total Energy consumed and SAP’s Greenhouse Gas Footprint.

On the data centre energy front, the energy increase is both in real terms, and in kWh per employee. This is likely due to SAP increasingly hosting customers data and applications through their cloud offerings. What might be interesting here would be to see a kWh per cloud customer metric, or similar. Also, one would suspect that there should be a net reduction in energy consumption for that application, if it is replacing a customer’s pre-existing on-premises application. There could be some interesting data to mine there around energy wins.

On the Total Energy Consumed page you see that energy consumption has increased from 843GWh in 2010 to 860GWh in 2011. In the report it attributes this to growth in the business (SAP bought SucessFactors during this period) but the lack of a kWh per Employee metric on this page makes this hard to verify.

On the Greenhouse Gas page, we again see an increase in emissions from the 453kTons 2010 figure to 490kTons in 2011. On this page, it is possible to see a By Employee figure and here too we see an increase in emissions from 8.7 tons per employee in 2010 to 9.0 tons in 2011. However, when we look at the emissions by ? revenue, we see a fall, from 36.3g/? in 2010 to 34.4g/? in 2011. 2011 was a good year for SAP, from a revenue perspective, it would appear.

On the upside, SAP has increased its use of renewable energy from 45% to 47%. Not a huge increase, to be sure, but at least this environmental metric is going in the right direction.

I mentioned that the site has a lot of social sharing built into it – there’s a “Share this page” on every page which allows you to share that page on your social network of choice (or print, or email!). However, in terms of interactivity, the report seems to have regressed. In the 2010 report, there was the ability to comment directly on any page, to rate comments, and see conversations taking place about the page, directly on the page. This functionality has been removed completely from the 2011 report, and to be honest, the report is the poorer for its removal. Browsing other readers comments on pages is always a superb way to gain others insights into the page content – both for consumers of the report, as well as for SAP.

From a UI perspective there are several glitches on the site (some rollovers not working; external links and links to PDF’s not made obvious; and inconsistent use of pretty permalinks etc.) but these are minor quibbles and easily fixed.

The 2010 report doubled individual visitors over the 2009 report, with the 2010 report receiving over 60,000 readers. SAP tell me they are aiming to maintain that progress and have over 120,000 visitors to this, the 2011 report. One huge advantage of having the report in the form of a website, is of course the invaluable data stream you receive from the visitor analytics to the report. Something which is impossible to achieve with a PDF.

On the whole, SAP’s 2011 report, with the removal of the interactivity and the increased energy and emissions, seems to have faltered slightly in terms of the tremendous progress it had been making to-date. To put that in perspective, SAP’s 2011 report is still one of the better produced sustainability reports.

For the 2011 report I’ll have to grade it as “very good, but could do better”.

Photo Credit Tom Raftery

post

Tendril courting developers for its cloud-delivered energy app platform

Green Carrot energy usage app

Last August Tendril, a US-based energy platform company, announced that they were opening their API’s and launching an energy application developer program. The idea is to allow developers to build on Tendril’s cloud platform and to deploy the developed applications on Tendril’s Tendril Connect cloud platform.

For developers this is an opportunity to develop applications addressing the energy challenge and have them deployed in a ready-made marketplace of up-to 70 million addressable households. Similar to the Apple App store, Tendril offers co-marketing opportunities for developed applications.

Tendril provides developers with, not just the API’s, but also comprehensive documentation with a “Try it Now” capability as well as a discussion forum (so far lightly used) to have questions answered.

Tendril has also been promoting this initiative to developers by participating in Hackathons in San Francisco and more recently in New York. In conjunction with the New York Hackathon, Tendril ran a contest to see who could come up with the best apps using their API’s. The winner, eMotivator, won $3,000, while 2nd placed Green Carrot (screenshot above) won $2,000 from Tendril and another $1,000 from the Hackathon organisers for ?best user experience?.

And I note that Tendril are listed as one of the Participating Organisations in the London Green Hackathon being organised by AMEE this coming weekend.

Of course, if Tendril really want to talk to developers, they should also be attending our RedMonk Monki Gras conference in London next week (Feb 1-2)! I’m not sure what the collective noun for developers is (I asked on Twitter and received the following suggestions – batch? class? scrum? repository?), but whatever it is, there’ll be a shedload of them there!

One of the interesting things about the Tendril open API initiative is that it should stimulate lots of creativity in the Smart Grid space. So far, as Tendril CTO Kent Dickson noted in a call with me the other day, no-one knows what the Smart Grid killer app will be, but crowdsourcing the ideas is far more likely to lead to compelling results.

post

HP joins ranks of microserver providers with Redstone

Redstone server platform

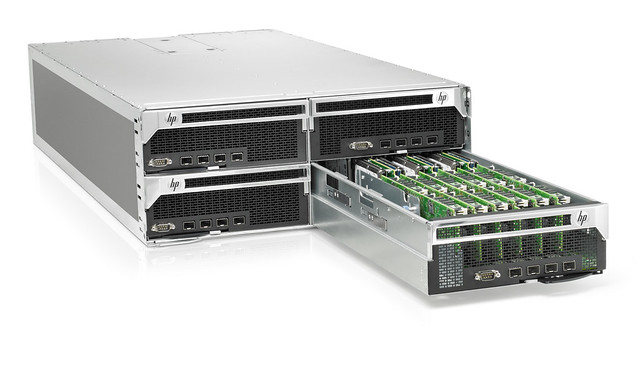
The machine in the photo above is HP’s newly announced Redstone server development platform.

Capable of fitting 288 servers into a 4U rack enclosure, it packs a lot of punch into a small space. The servers are System on a Chip based on Calxeda ARM processors but according to HP, future versions will include “Intel? Atom?-based processors as well as others”

These are not the kind of servers you deploy to host your blog and a couple of photos. No, these are the kinds of servers deployed by the literal shedload by hosting companies, or cloud companies to get the maximum performance for the minimum energy hit. This has very little to do with these companies developing a sudden green conscience, rather it is the rising energy costs of running server infrastructure that is the primary motivator here.

This announcement is part of a larger move by HP (called Project Moonshot), designed to advance HP’s position in the burgeoning low-energy server marketplace.

Nor is this anything very new or unique to HP. Dell have been producing microservers for over three years now. In June and July of this year (2011) they launched the 3rd generations of their AMD and Intel based PowerEdge microservers respectively.

And it’s not just Dell, Seamicro has been producing Atom-based microservers for several years now. Their latest server, the SM10000-64 contains 384 processors per system in a 10U chassis with a very low energy footprint.

And back in April of this year Facebook announced its Open Compute initiative to open-source the development of vanity free, low cost compute nodes (servers). These are based on Intel and AMD motherboards but don’t be surprised if there is a shift to Atom in Open Compute soon enough.

This move towards the use of more energy efficient server chips, along with the sharing of server resources (storage, networking, management, power and cooling) across potentially thousands of servers is a significant shift away from the traditional server architecture.

It will fundamentally change the cost of deploying and operating large cloud infrastructures. It will also drastically increase the compute resources available online but the one thing it won’t do, as we know from Jevons’ Paradox, is it won’t reduce the amount of energy used in IT. Paradoxically, it may even increase it!

Photo credit HP

post

3 easy steps to see if your Cloud solution is energy efficient

Cloud

I’ve written a number of posts questioning whether Cloud Computing is Green or Energy Efficient but to be a little more helpful, here is a simple test you can do to see if your Cloud Computing delivered applications are yielding energy efficiency gains for you:

  1. Have you moved some of your applications to a Cloud provider? – if “Yes” go to step 2 (if no, then cloud is not saving you energy)
  2. Do you know what the energy consumption* of that application was before moving it to the cloud? – if “Yes”, go on to step 3 (if no, then you have no way to tell if your Cloud solution is saving you energy)
  3. Do you know the energy consumption of your application after it has moved to the Cloud? – if “Yes” subtract 3 from 2 and if the answer is positive then Cloud is saving you energy (if no, then you have no way to tell if your Cloud solution is saving you energy)

*Obviously, the units of energy consumption in steps 2 and 3 need to be the same for this to work. To make sure they are, try contacting your Cloud provider before moving your applications to the Cloud and asking them what their method for measuring energy consumption is. If they tell you (more than likely they won’t) you can match your measurement units in step 2 to theirs.

Unfortunately, as Cloud Computing providers are, as yet, not publishing energy consumption information, for now, this only works as a thought experiment. However with coming regulatory requirements around reporting of energy consumption, Cloud Providers may be forced to reveal this information.

It is only when Cloud providers detail their energy consumption information that we will be able to say whether Cloud Computing is energy-efficient, or not.

Photo credit kevindooley