post

Why are Salesforce hiding the emissions of their cloud?

Salesforce incorrect carbon data

The lack of transparency from Cloud computing providers is something we have discussed many times on this blog – today we thought we’d highlight an example.

Salesforce dedicates a significant portion of its site to Sustainability and on “Using cloud computing to benefit our environment”. They even have nice calculators and graphs of how Green they are. This all sounds very promising, especially the part where they mention that you can “Reduce your IT emissions by 95%”, so where is the data to back up these claims? Unfortunately, the data is either inaccurate or missing altogether.

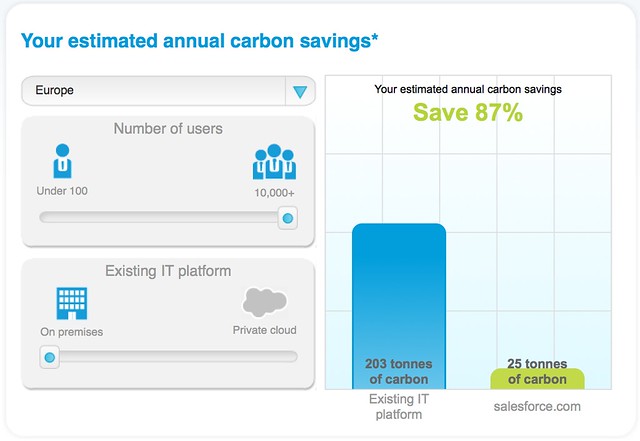
For example, Salesforce’s carbon calculator (screen shot above) tells us that if an organisation based in Europe moves its existing IT platform (with 10,000+ users) to the Salesforce cloud, it will reduce its carbon emissions by 87%.

This is highly suspect. Salesforce’s data centers are in the US (over 42% of electricity generated in the US comes from coal) and Singapore where all but 2.6% of electricity comes from petroleum and natural gas [PDF].

On the other hand, if an organisation’s on premise IT platform in Europe is based in France, it is powered roughly 80% by nuclear power which has a very low carbon footprint. If it is based in Spain, Spain generates almost 40% of its power from renewables [PDF]. Any move from there to Salesforce cloud will almost certainly lead to a significant increase in carbon emissions, not a reduction, and certainly not a reduction of 87% as Salesforce’s calculator claims above.

Salesforce incorrect carbon data

Salesforce also has a Daily Carbon Savings page. Where to start?

To begin with, the first time we took a screen shot of this page was on October 1st for slide 26 of this slide deck. The screen shot on the right was taken this morning. As you can see, the “Daily Carbon Savings” data hasn’t updated a single day in the meantime. It is now over two months out-of-date. But that’s probably just because of a glitch which is far down Salesforce’s bug list.

The bigger issue here is that Salesforce is reporting on carbon savings, not on its carbon emissions. Why? We’ve already seen (above) that their calculations around carbon savings are shaky, at best. Why are they not reporting the much more useful metric of carbon emissions? Is it because their calculations of emissions are equally shaky? Or, is it that Salesforce are ashamed of the amount of carbon they are emitting given they have sited their data centers in carbon intensive areas?

We won’t know the answer to these questions until Salesforce finally do start reporting the carbon emissions of its cloud infrastructure. In a meaningful way.

Is that likely to happen? Yes, absolutely.

When? That’s up to Salesforce. They can choose to be a leader in this space, or they can choose to continue to hide behind data obfuscation until they are forced by either regulation, or competitive pressure to publish their emissions.

If we were Salesforce, we’d be looking to lead.

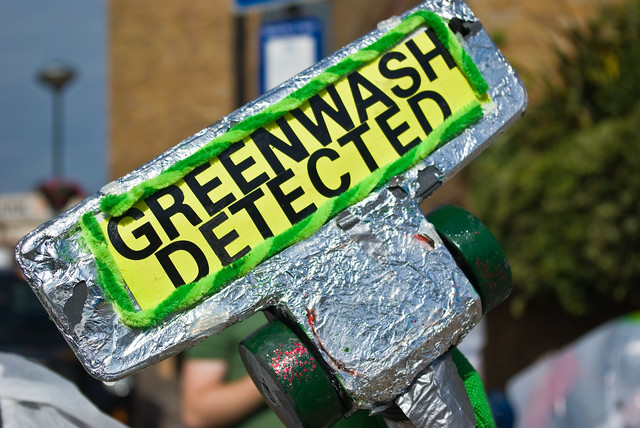
Image credits Tom Raftery

post

Cloud Computing: Google Apps cloud has a relatively high carbon intensity

Cloud

I have been researching and publishing on Cloud Computing for quite some time here. Specifically, I’ve been highlighting how it is not possible to know if Cloud computing is truly sustainable because none of the significant Cloud providers are publishing sufficient data about their energy consumption, carbon emissions and water use. It is not enough to simply state total power consumed, because different power sources can be more, or less sustainable – a data center run primarily on renewables is far less carbon intensive than one that relies on power from an energy supplier relying on coal burning power stations.

At Greenmonk we believe it’s important to get behind the headline numbers to work out what’s really going on. We feel it’s unacceptable to simply state that Cloud is green and leave it at that, which is why we’ve been somewhat disappointed by recent work in the field by the Carbon Disclosure Project. We would like to see more rigour applied by CDP in its carbon analytics.

Carbon intensity should be a key measure, and we need to start buying power from the right source, not just the cheapest source.

I was pleasantly surprised then yesterday when I heard that Google had published a case study ostensibly proving that Cloud had reduced the carbon footprint of at least one major account.

However, it is never that straightforward, is it?

The Google announcement came in the form of a blog post titled Energy Efficiency in the Cloud, written by Google’s SVP for Technical Infrastructure, Urs Hölzle. I know Urs, I’ve met him a couple of times, he’s a good guy.

Unfortunately, in his posting he heavily references the Carbon Disclosure Project’s flawed report on Cloud Computing, somewhat lessening the impact of his argument.

Urs claims that in a rollout of Google Apps for Government for the US General Services Administration,

the GSA was able to reduce server energy consumption by nearly 90% and carbon emissions by 85%.

An 85% reduction in carbon emissions sounds very impressive – but how does Google calculate that figure? Also worth considering is the age of the server estate – any data center that decommissions older servers in favour of new ones is likely to see an efficiency bump. Assuming the GSA servers running Microsoft apps were more than five years old, they would have seen a considerable efficiency bump simply by running the apps on new servers, on premise or off. Without disappearing down a rathole, its also worth noting cradle to cradle factors in server manufacturing – supply chains consume carbon.

We looked at a whitepaper titled Google Apps: Energy Efficiency in the Cloud [PDF], where the search company shares some of the methodology behind the blog post. We would like to see a lot more detail about assumptions and methods.

The key reference to how Google calculated carbon emissions is this line:
The following summary tallies up every GSA server dedicated to email and collaboration across 14 locations in the continental U.S. and applies the appropriate PUEs, electricity prices, and carbon intensities for each location

Here’s the table:
Google Apps GSA case study

The data in the table above is interesting but if you look at the carbon information, you start to notice something strange – here’s a slightly different view on Google’s data:

Google Apps carbon intensity

While it is no real surprise that Google’s servers produce less CO2 per annum than the GSA’s (4.75 vs 7.69 tons), what is very surprising (to me at least) is the fact that Google’s facilities are significantly more carbon intensive than the GSA’s were (14.5 vs 10.63 tons of CO2 per kWh).

In simple terms, carbon intensity is a measure of the amount of CO2 released in the generation of electricity. The data above, clearly show that the data centres hosting the Google Apps Cloud are not optimised for reduced emissions (the best way for data centers to optimise for reduced emissions is to source electricity generated from renewable sources).

I guess the good news is that, while Google has helped the GSA to reduce its carbon emissions, there’s plenty of room for improvement!

I reached out to Urs for a response to this and because he’s traveling at the minute, the only answer I received pointed out that since 2007 Google’s net emissions are zero. And, in fairness to Google, they do fund some worthwhile offsetting projects, as you can see in the video below (check out the farmer towards the end, he’s just awesome!).

Cloud photo credit mnsc

post

Don’t forget – where your cloud apps are hosted helps determine their carbon footprint

Greenwash

Back in July of this year (2011), the Carbon Disclosure Project (CDP), in conjunction with Verdantix, released a report titled Cloud Computing – The IT Solution for the 21st Century [PDF warning] which erroneously claims Cloud Computing is Green. Shortly after it was released, I wrote a long post outlining exactly where the report was flawed. I also contacted the CDP directly outlining my concerns to them and pointing them to the blog post.

Then, a couple of weeks back, when preparing my slides for my Cloud Computing’s Green Potential talk for the Cepis and Hepis Green IT conference in Athens, I discovered that Verdantix and the CDP had published

a new report [PDF] on the business and environmental benefits of cloud computing in France and the UK

Unfortunately, not only does the new report make the same mistakes as the original one, but it further compounds those errors with an even more fundamental one.

Let me explain.

In the key assumptions section of the report it talks about the metric tons of CO2/kWh in both the UK and French electricity grids (0.000521 tonnes and 0.000088 tonnes respectively). It uses these figures to extrapolate the savings in both France and the UK for companies migrating their applications to cloud computing.

So? You say. Sounds reasonable to me.

Well, the issue is that they didn’t do any work to identify where applications migrated to the cloud would be hosted. The implication being that UK applications migrated to the cloud, will be hosted on UK cloud infrastructure and French IT applications will be migrated to French hosted cloud infrastructure. In fact this would be a highly unusual scenario.

A quick look at where most cloud hosting takes place shows that the vast majority of it is occurring in the US, with quite a lot happening in Singapore with a lesser amount in Europe (and that split between Ireland, Germany, UK, etc. but almost none in France – Ireland is underestimated in the list as it doesn’t include Microsoft which has a significant Cloud hosting facility in Dublin which it is now expanding or Google’s Dublin facility).

Ok, and what about the carbon intensity of electricity generation in these countries? If a cloud application is moved to somewhere with a lower carbon intensity for electricity generation, then there is a possibility of a carbon saving. However, with the vast majority of cloud hosting still being done in the US, that isn’t a likely scenario.

This table of CO2 emissions from electricity generation, by country shows that the US has one of the most carbon intensive electrical grids in the world. France, on the other hand, with its high concentration of nuclear power (78%) has one of the least carbon intensive electricity grids in the world. While the UK grid’s carbon intensiveness at 557kg CO2/mWeh sits just above the world average of 548kg CO2/mWeh.

While it is possible (though not probable) that UK IT applications outsourced to the cloud would be hosted in a country with a lower carbon intensity than the UK, the chances of a French IT application being hosted in a country with a lower carbon intensity than France are virtually nil.

Given this, the assertion by the CDP report that

large businesses in France and the UK can reduce CO2 emissions from their IT estate by 50% compared to a scenario where there was no cloud computing.

seems, at best, extremely improbable.

One problem with coming up with reports like this is the lack of transparency from cloud providers on their locations, their energy and carbon footprints. If all cloud providers reported these metrics, it would be a far simpler matter to decide whether cloud computing is green, or not. Without these data, there is absolutely no way to say whether moving to the cloud increases or decreases CO2 emissions.

If you are wondering why the Carbon Disclosure Project and Verdantix are so bullish in their assertions that Cloud Computing is Green – if you scroll to the bottom of the report, you’ll see this:

CDP & Verdantix's motivations

This study was supported by AT&T
For more information on AT&T Cloud Solutions go to …

The report was paid for by the Cloud Solutions division of AT&T. Enough said.

Photo credit fotdmike

post

Power Usage Efficiency (PUE) is a poor data center metric

Problems with PUE

Power Usage Effectiveness (PUE) is a widely used metric which is supposed to measure how efficient data centers are. It is the unit of data center efficiency regularly quoted by all the industry players (Facebook, Google, Microsoft, etc.).
However, despite it’s widespread usage, it is a very poor measure of data center energy efficiency or of a data center’s Green credentials.

Consider the example above (which I first saw espoused here) – in the first row, a typical data center has a total draw of 2MW of electricity for the entire facility. Of which 1MW goes to the IT equipment (servers, storage and networking equipment). This results in a PUE of 2.0.

If the data center owner then goes on an efficiency drive and reduces the IT equipment energy draw by 0.25MW (by turning off old servers, virtualising, etc.), then the total draw drops to 1.75MW (ignoring any reduced requirement for cooling from the lower IT draw). This causes the PUE to increase to 2.33.

When lower PUE’s are considered better (1.0 is the theoretical max), this is a ludicrous situation.

Then, consider that not alone is PUE a poor indicator of an data center’s energy efficiency, it is also a terrible indicator of how Green a data center is as Romonet’s Liam Newcombe points out.

Problems with PUE

Consider the example above – in the first row, a typical data center with a PUE of 1.5 uses an average energy supplier with a carbon intensity of 0.5kg CO2/kWh resulting in carbon emissions of 0.75kg CO2/kWh for the IT equipment.

Now look at the situation with a data center with a low PUE of 1.2 but sourcing energy from a supplier who burns a lot of coal, for example. Their carbon intensity of supply is 0.8kg CO2/kWh resulting in an IT equipment carbon intensity of 0.96kg CO2/kWh.

On the other hand look at the situation with a data center with a poor PUE of 3.0. If their energy supplier uses a lot of renewables (and/or nuclear) in their generation mix they could easily have a carbon intensity of 0.2kg CO2/kWh or lower. With 0.2 the IT equipment’s carbon emissions are 0.6kg CO2/kWh.

So, the data center with the lowest PUE by a long shot has the highest carbon footprint. While the data center with the ridiculously high PUE of 3.0 has by far the lowest carbon footprint. And that takes no consideration of the water footprint of the data center (nuclear power has an enormous water footprint) or its energy supplier.

The Green Grid is doing its best to address these deficiencies coming up with other useful metrics such as, Carbon Usage Effectiveness (CUE) and Water Usage Effectiveness (WUE).

Now, how to make these the standard measures for all data centers?

The images above are from the slides I used in the recent talk I gave on Cloud Computing’s Green Potential at a Green IT conference in Athens.

post

Dell claims carbon neutrality 5 months ahead of schedule

In June of this year, Dell re-asserted its aim of becoming the Greenest Technology company on the planet with a post which included nuggets like:

  1. recycled 102 million pounds of IT equipment from customers during 2007, a 20 percent increase over 2006
  2. became the first major computer manufacturer to offer desktop customers Silver 80 PLUS-certified power supplies
  3. the company’s laptops and desktops, already among the industry’s most energy-efficient, are being designed to consume up to 25 percent less energy by 2010 relative to systems offered today and
  4. The company’s carbon intensity (CO2 emissions/revenue) is among the lowest of the Fortune 50 and less than half that of its closest competitor

Then just last week Dell announced that it had met its aim of becoming a carbon neutral company five months ahead of schedule. It did so using a combination of “an aggressive program to improve efficiencies in the company, purchasing green energy directly as well as renewable energy credits and verified emissions reductions” according to Dane Parker, Dell’s Director of Environment, Health, & Safety.

Some have sounded a note of skepticism saying things like:

You have to question whether they have taken all their workers’ commuting into consideration, and the materials (involved) in making a computer, going all the way back to zinc mining

and

Carbon neutrality is a large amount of greenwash. Computer companies should be focusing on the developments made in recent years in the reduction of harmful material inside the computers, and reduction in the power that computers use. With these high claims, companies are setting themselves up to be knocked back down again

And while there is some validity to this, in fairness to Dell, they have implemented a policy that requires their suppliers to report their emissions during quarterly business reviews, so they are pushing this back down the supply chain and it is hard to argue with the fact that Dell’s carbon intensity (CO2 emissions/revenue) is less than half that of its closest competitor.

We need to see a lot more companies following Dell’s lead in this. Having said that, independent verification of the carbon neutral claim by a trusted third party would do away with any lingering doubts about Dell’s commitment to Green once and for all.

[Disclosure – Dell are a GreenMonk client]