Search Results for: cloud

post

Can we hack open source cloud platforms to help reduce emissions – my Cloudstack keynote talk

This is a video of me giving the opening keynote at the Cloudstack Collaboration conference in Las Vegas last December. The title of my talk was Can we hack open source cloud platforms to help reduce emissions and the slides are available on SlideShare here if you want to download them, or follow along.

Be warned that I do drop the occasional f-bomb in the video, so you might want to listen to this with headphones on if there are people nearby with sensitive ears 😉

And I have a transcription of the talk below:

Good morning everyone! I’m absolutely astounded of the turn out at this time on a Saturday morning. I said to Joe yesterday evening, I think it was, that I reckoned it would be just me and the AV guy here this morning but now you’ve turned up. That’s a fantastic, phenomenal. Thank you so much. I hope we make it worth your while. My talk, Joe mentioned I’m from RedMonk. RedMonk is an analyst firm. I work on the green side of a house, so I’m all about energy and sustainability. I’m talking about using open source cloud platforms to measure and report energy and emissions from cloud computing.

A couple of quick words about myself first. As I said, I lead analyst energy and sustainability with RedMonk. You can see there, my blog is on greenmonk.net. My Twitter account is there. My email address is there. My phone number is there. Please don’t call me now. I’m using the phone as my slide forwarder. SlideShare, I’ll have this talk up on SlideShare shortly.

Also, a couple of companies I’ve worked with. I worked to the company called “Zenith Solutions” back in the mid-’90s. It’s a company that I set up in Ireland. As we called it at the time, it was a web applications company. Web applications at that time morphed into SaaS, “Software as a Service.” Back in the mid to late 90s, I was setting up these Software as a Service Company, so I knew a little bit about cloud. Then Chip Electronics was an ERP company, but it was a Software as a Service delivered ERP. That was around 2002. CIX, the other company that’s there.

CIX is a data center company that I founded in 2006 in Ireland. I kind of know a little bit about cloud both from the software and from the hardware side. I’ve setup a data center and I’ve also setup software companies dealing with cloud stuff. Like I say, a little bit of the background in it. I know what I’m talking about, not that much, but I’ll bluff it.

This is a report. It’s a graph from a report that came out just a couple of weeks ago. It’s from WSP Environmental and the NRDC. Basically, what they’re saying in this report, it’s a long report, the link is at the bottom there. As I say, this talk will be on SlideShare, so you can link on the link in SlideShare and get straight to the report. What the report is saying basically is that cloud computing is green. There have been a couple of reports like that which have said that. Most of them have been tainted before now. There was one that Microsoft helped put out, obviously Microsoft have got a foot in the game so you kind of wonder about that one. There was another one that was put out by the Carbon Disclosure Project, but it was paid for by AT&T. That was highly suspect. This one’s actually quite good. They’ve done quite a bit of work on it. You actually have to take it seriously unlike the previous two and it does seem to suggest that cloud computing is green, and that’s good.

Previous ones, as I say were suspect. The issue with this that I have and it’s a small issue, but this issue or this report is a really good report but it’s speculative. It says cloud computing should be green. Probably, is green. Maybe green, but they’re not working on any hard data and that’s where we’ve got a serious problem with cloud computing.

Taking a step sideways for a second, this is a guy called Garret Fitzgerald. Garret Fitzgerald was a politician in Ireland in the ’80s and ’90s. He died last year. A very unusual politician because he was one of the very few politicians who actually have integrity, very well-know for his integrity. He was also not just known for his integrity, but he was an academic. He came from an academic background. He worked in Trinity College Dublin as a statistician, so he was a data guy.

Now, in the mid-’40s, the Aeroflot, Russian Airline Company, it was at ’47 I think or ’49, for the first time, published their flight schedule. They’d never done this before. They published their entire flight schedule, their global flight schedule. Garret Fitzgerald looked at this, analyzed it and figured out he could know by going through this in detail, he could figure out the exact size of the Aeroflot fleet down to the number and types of planes they had in their fleet, and this was a state secret.

This was nothing that had ever been published before, but by analyzing their schedules, he worked it out and he published it, and as a result, the KGB had a file on him because they thought he was a spy.

Two things about this slide, first is you do a creative common search on Flickr for KGB, and this is one of the images you’ll find. It’s got a KGB logo and his got a cat, so you got two memes right there. A, the internet is fucking awesome and B, well the main thing to take away from this is that there is no such thing as security by obscurity. Hiding your data will not work. Somebody will figure the damn thing out. That’s where we’ve got a big issue with cloud computing because there is absolutely no transparency in cloud computing.

This is a blog post that I’ve put up. If you follow greenmonk, which is where I blog at greenmonk.net, you’ll find there’s a ton of blog posts on this very topic, the lack of transparency in cloud computing. I have done blog posts about it. I’ve given webinars about it. I’ve hassled people about in the space. The SalesForces, the Rackspaces, I’ve hassled them all.

Recently, the New York Times picked up the story. I’m not going to say it has anything to do with me, they actually run a really good story. Again, the link is at the bottom there. One of the things that they have mentioned in that story — please do go and click on that link and read that article. It’s a really good article.

One of the things they have mentioned in that article is a McKinsey study. In that McKinsey study, they say that globally for data centers, somewhere between six percent and 12%, depending on the data center, somewhere between six percent and 12% of the power going into the servers in the data centers is used for computing. The other 88% is used for elasticity. It’s used to keep them going in case there’s a burst of activity, so 88%, if we take a conservative look, 88% of the power going into those servers is the E in Elastic Cloud, horrific waste.

Do you think that people’s often mistake in this area, is people often equate or conflate energy with emissions, and that’s a mistake. They are not the same thing, not at all. The reason they are not is because if you take the example of — for example, the Facebook Data Center in Prineville, Oregon, a fabulous data center. They’ve opened sourced it, the whole open compute project. They’ve opened sourced the entire building on this data center.

The data center, if you know anything about data center statistics, there’s a metric for data centers called the PUE. The PUE is the Power Usage Efficiency. The closer you are to one, the more efficient you are. Facebook’s data center comes in around 1.07 or 1.08, depending on time of the year on usage and stuff like that, but it’s in and around 1.08. It’s almost unheard of efficiency, 1.5 is kind of average, 2.0 is older data centers, and 3.0 is dirty. This is 1.07 or 1.08.

Unfortunately, although it’s extremely efficient — this is Facebook’s numbers here, 1.08 plus their computing power has declined by 38%, but the problem with that is, this data center is powered by company called PacifiCorp. PacifiCorp are the local utility in Oregon, in Prineville where this is based.

PacifiCorp mines 9.6 million tons of coal every year. It doesn’t matter how efficient your data center is. If you’re mining 9.6 million tons of coal to run your Facebook data center, it’s not green. I don’t care how efficient it is. It’s not a green.

It’s not just Facebook, it’s not just Prineville, Dublin, in Ireland, I’m Irish — guilty. Dublin has become a center for cloud computing as well. All of the big companies are there. Microsoft is there, they got their big Live servers there, Google are there, Amazon are there, they’ve all got data centers there. Ireland, unfortunately, gets 84% of its electricity from fossil fuels. Again that’s not very green. It’s not just Ireland, the U.K. is another big center for cloud computing in London, and again, over 90% of the electricity in the U.K. comes from fossil fuels. This is really, really bad stuff.

Now, if you look at this chart, this is why I say that the PUE which is in the middle column here, isn’t a whole lot important because as I said, if you look at the bottom row there, it’s got a PUE of three I said that was really dirty. Top row, PUE of 1.5 is at the average, middle row PUE of 1.2 kind of in the middle, but if you look at the power source coming into these putitive data centers, so your typical one, the top line, typical one has a supply carbon intensity of half a kilo per kilowatt hour, that’s pretty standard. If that has a data center PUE of 1.5, then you’re getting simple math, 0.75 a kilo per kilowatt hour. If you have a good PUE of 1.2, but with coal fired power coming at 0.8 of a kilo per kilowatt hour, you’re now looking at IT carbon intensity of 0.96.

Look at the bottom line, a PUE of three, one of the dirtiest data centers you can get, but it’s powered almost all by renewables, it’s not all because it’s got a 0.2 kilograms and a PUE of three, it still comes in at an IT carbon intensity of 0.6, which is far better than the 1.2 PUE or the 1.5 on typical. The take home message from this slide is that it’s the source of the electricity is what determines the carbon footprint of your cloud, not the efficiency of your data center.

Now, if we look at some of the cloud providers that are out there today and if I left anyone out, apologies, I just stuck these logos up based on the availability of the logos. It’s not an any kind of research or anything but that.

If we look at the cloud providers that are out there, these ones are semi-clean. If we look, for instance, at Rackspace, they have a data center in the U.K. which they claim as 100% powered by renewables. Now, they haven’t given us a whole load of data, but let’s just take the word on it. If you go with Rackspace and you go with their U.K. data center it’s supposedly 100% green, we’ll see. Google, Google have done a really good job on investing in renewables. They spent almost a billion dollars on buying into Windfarms, power purchase agreements with big Windfarms the whole thing. They’ve gone out on a serious limb, in terms of renewables. I’m pretty positive about them. They’re still doing a lot of the old buying carbon credits and stuff like that, but they got old data centers that they need to top up with carbon credits.

Green Cloud is an interesting one. Green Cloud are company that bill themselves as an AWS replacements, dropping AWS replacement and why they are cool is because — pun intended.

They’re cool because they’re based in Iceland. The electricity grid on Iceland is 100% renewable, its 30% geothermal, 70% hydro. The entire grid is a 100% renewable energy and it’s baseload energy and what’s even more interesting about it, as a grid is, there are 300,000 people living in Iceland, that’s it — 320,000. They’ve realized that they got this energy infrastructure and way more energy than they can every use, so they decided to invite people who need lots of energy. I’m not talking about data centers. I’m talking about Aluminium Smelting Plants.

So, they got Aluminium Smelting Plants in Iceland. These guys take up 500 megawatts at a time. A big data center is 50 megawatts. They’re 10 times the biggest data center you’ve ever come across, in terms of the power utilization. They are on all day, everyday, 24/7, 365, it’s a flat line. Any electricity grid you look at, if you look at the demand curve, it goes like that everyday. Peaks in the morning, when people get up, peaks in the late afternoon when people come home from work. Iceland, the flat line all the way. It is the only country whose electricity grid is just flat all the time. It’s always on. It’s always flat. There is no movement in it or whatsoever. It is the most reliable electricity grid in the world. It’s also one of the cheapest. It’s also 100% green.

If you are looking to site a data center, I recommend Iceland. Greenqloud are based there, and as I say, their Cloud is obviously 100% green. We’ll come back to them.

Amazon put out this report earlier this year where they said that, “Both their Oregon and their GovCloud were a 100% carbon free”. That sounds nice. Unfortunately, when you actually ask them about it, so this is Bruce Durling, a guy I know in the U.K. He asked Jeff — it’s a story for this 100% green claim that it’s just going out. Jeff says, “You know, we don’t share any details about it, but I’m happy to hear you like it.” Bruce comes back and says, “How can we verify if this is true, there are lots of different ways to claim zero carbon.” And then you’ll just hear cricket chirps, nothing, no data, and no response. Bruce isn’t the only guy, several people took Jeff up on this asked him, “What’s the story with your claim for 100% green in these two clouds? “Nothing, nothing.” And it’s appalling that they are not talking because this is the kind of stuff we need to know. There is no data coming at of a lot of the cloud manufacturer or cloud providers.

Looking again at the cloud providers I’ve mentioned, if we look at some of the ones who are providing some data. If we look, for example, at SAP, SAP has got a really good sustainability report that they release every year. In fact they release quarterly even better. Unfortunately, the only data, they give us about their Cloud, is that eight percent of their carbon emissions are from their data centers. That’s as granular as it gets. We know no more about their carbon emissions, about their Cloud than that.

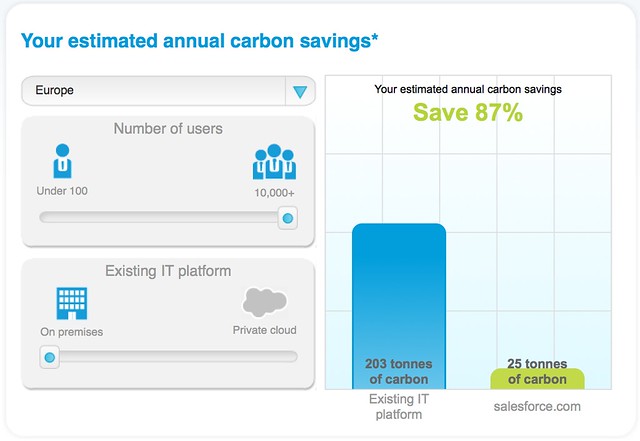
If we look at Salesforce, Salesforce go a little further. Salesforce have got this carbon calculator under site which is interesting. If you choose as I did in this screen shot, you can see I chose — I was based in Europe which I am. I decided to say I was in a company of 10,000 plus, and I decided to say, “Look, I’m going from on-premise to Salesforce. So, they tell me, “Fantastic! You’re going from on-premise, 10,000 plus based from Europe you’re going to save 86% and 178 tons of carbon by moving to Salesforce, but of course that’s complete horse shit because Europe is not homogenous.

If I’m based in France, 80% of the energy in France is nuclear. If I’m based in Spain, which I am, 40% of the energy in the Spanish grid comes from renewables. There is no way that if I move my on-premise from France or Spain to Salesforce that I’m saving 178 tons of coal per annum. In fact, if I move to Salesforce, my carbon emissions are going to go up not down because Salesforce’s data centers are in the U.S. which is 45% coal or they’re in Singapore. Singapore is — if memory serves 93% fossil fuel so there is no way moving to Salesforce from a lot of the European countries is a step on the right direction in terms of green.

The other thing that they have — you can click on the link at the bottom of this as well on the Salesforce site. This is where they have your daily carbon savings. There are two problems with this, the first is — this screen shot was a couple of days ago and you could see they’re talking about the 13th of September is the most recent date, so it’s two months or more out-of-date. The second is they’re talking about carbon savings, which is bullshit made-up number. What they should be talking about is actual carbon emissions because they can just make up the carbon savings because it’s basing where you’re from. Like I say if I’m in Spain and my carbon savings are at a zero going to Salesforce. They should be talking about emissions not carbon savings of completely the wrong metric.

I talked about Greenqloud. Greenqloud, have this on their site which is nice. You log into Greenqloud — over the righthand side is part of your dashboard, you get your carbon figures. They are as well, and this is a conversation I’m having with them at the moment, they are also talking about the CO2 savings, they’re not talking about actual emissions. There are emissions obviously, if you’re working with Greenqloud, their CO2 footprint is negligible because it’s Icelandic, but there is that carbon expended between your laptop or your desktop and going to them. There is carbon put out there but it’s negligible compared to mostly of the other providers. The difficulty with this, as they say, is they’re talking about CO2 savings not CO2 emissions. I’m hoping to get them to change that.

Why don’t the Cloud providers provide this data? There are number of reasons. I’m speculating here. I don’t know. I’ve asked them, they’ve all said different reasons. One of them I’m going to think is competitive intelligence. They don’t want people to know what their infrastructure is. They don’t want people to do the Garret Fitzgerald and reverse engineer, to find out what it is they’re actually using to power their facilities. Another is maybe they don’t actually want people to know how much CO2 they’re pushing out. It’s not a happy story.

The other is, in fairness, there’s a lack of standards out there about cloud companies reporting emissions because how do you report emissions around cloud computing? Do you do it at CO2 per flop? What’s the metric? We don’t know, no one is doing it yet so we don’t know.

Peter Drucker, the management guru, is famous for saying, “If you can’t measure it, you can’t manage it.” That holds true. That does hold true for everything, and particularly in this space.

I’m going to go through a quick recap of 2012 and this is not going to be pleasant. This is an image taken from the U.S. Drought Monitor in September but it’s even more so now. So far, U.S. agriculture has loss $12 billion just in Q3 because of drought. It’s not just drought, there’s been massive wildfires globally, not just in the U.S. There’s been massive floodings everywhere, not just the floodings, but also a new report came out in the last week, and again the link is at the bottom, which says that, “Sea level rise globally is actually 60% higher than had been previously calculated.” They had thought sea levels were rising two millimeters per annum. It turns out sea levels are actually rising 3.2 millimeters per annum.

We have had more than 2000 heat records in June alone of this year in the U.S. alone, the sea ice — I got a chart here, you can look it up afterwards. I’ve got another chart here you can look it up afterwards, and I got an image here. It’s hard to see, but that’s the polar ice cap in September 13th when it was at its minimum.

The orange line outside that is the 30-year average at that time for the sea ice extent. It’s almost 50% less than what it should have been at that time. It’s scary. It’s scary stuff because when we lose the arctic and we’ve lost 50% of it this year, when we lose the arctic, you got a feedback mechanism because when you don’t have the ice to reflect the heat, you’ll got the water taking in the heat, and it gets hotter and it’s a feedback mechanism so the ice underneath melts as well, so you no longer have multi-year ice.

You got methane emissions, that’s literally methane coming from underneath the ice from organisms that had been frozen, but because everything heated up a little bit. They started producing methane. Now, another report out in the last week in the UNDP says, “The thawing of the permafrost is going to cause us enormous problems and it hasn’t been taken into account previously in any of the climate models.” None of the IPCC reports, up until now, have taken permafrost thawing into account because they think it was going to be significant. Suddenly, they’re realizing that the thawing of the permafrost is decades ahead of where they thought it would be. This is serious stuff because this could be 40% of the global carbon emissions soon, not good. It’s a big feedback mechanism again.

So okay, the Cloud. The hell is that going to do with cloud? I get it. Cloud isn’t responsible for all these emissions. I know that, but it’s responsible for some of them, at least two percent of the global carbon emission is coming from IT and that’s a 2006 Gartner figure(ph). So, it’s likely, significantly higher at this point.

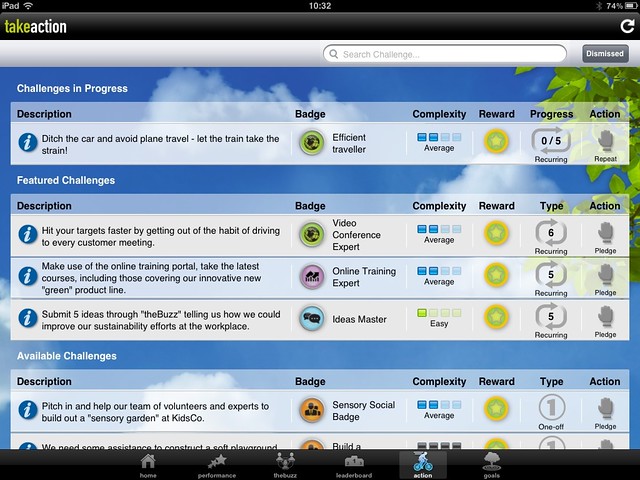
What’s that going to do with open source? Why are we here? Well, I got to think that we’ve got this open source cloud platforms out there. There are a significant number of developers in the room. I think it’s entirely possible that people in this room could start writing patches for the open source cloud platforms that are there, so that the Cloud providers no longer have an excuse to say, “Oh, we can’t do it because it’s not in the software.”

If you guys start writing the software for them, start doing the energy emissions, reporting, and measurement software writing those patches for the open source global platforms. Then suddenly, it gets in to the core. It starts being deployed back out to the companies that are using these platforms.

This is the company called AMEE. Interestingly they’re a U.K. start-up, not really a start-up, they’re around four years now, but they named the company AMEE as the “Avoiding Mass Extinction Engine.” They don’t boast about that, but that’s where they got the name. They are an open source platform for carbon calculation. They’ve got open APIs. If you guys want to do this stuff, work with the AMEE open APIs because they’ve got all the data.

Then, as I say, it gets thrown back out to the client companies of the open source cloud platforms and then we’ve get serious traction. This is what we need to have happen. By the way, there’s a company called Mastodon C. I mentioned AMEE already. There’s another company called Mastodon C out there, who has a dashboard already in place, showing us the carbon emissions of the various cloud providers. It’s not great. They’re guessing it because the cloud providers aren’t reporting it. They’re guessing it based on the location of the cloud companies and utility companies who provide them with their energy but it’s better than nothing.

One other thing I should mention and I don’t want to be totally negative, but this should scare the fuck out of everyone in this room. PricewaterhouseCoopers, not known as being green, agitators, activists, there are the largest of the big four accounting companies. They came out with this report two weeks ago. It’s their carbon report. They come out with it annually. This report tells us that between the years 2000 and 2011 globally, our carbon emissions went down by 0.8% every year. That’s good, 0.8% reduction carbon emissions year on year.

The trouble is we’ve decided we want to keep our global warming figures. We want you to cap the warming at two degrees centigrade. Beyond that, it starts to get very hairy. The temperature has already gone up 0.8 of a degree centigrade, so we’ve got 1.2 degrees left.

According to PwC, the only way to keep this at two degrees is to reduce our carbon emissions not by 0.8%, as we’ve been doing, but to reduce our carbon emissions 5.1% every year between now and 2050. Six times the carbon reductions we’ve been doing for the last 11 years, every year for the next 38 years. So, sorry to be on a bit of a downer, but I have some good news.

This is Jim Hagemann Snabe. Jim is the co-CEO of SAP. I had a conversation with him in Madrid last week about this very topic and about… they are a cloud provider, I was asking him, “Why the hell aren’t you talking? Why aren’t you giving us your numbers? It wasn’t something he was aware of, it wasn’t something he had thought about, and Jim is actually a good guy. He’s actually a sustainability guy. Anytime you hear him talk, in the first three, four minutes of his talk, any talk he gives, he’ll bring up sustainability. Maybe sideways, he’ll talk about resource constraints or something, but he’s always thinking about this. When I brought this up with him, he was blown away because it hadn’t occurred to him at all and he said, “Tom you’re absolutely right, this is a space I want SAP to lead in.” Hopefully, something will come out of that, but it’s not just that.

This is Robert Jenkins. Robert is the CEO of CloudSigma, a Swiss-based company who are a Cloud Company. I’ve had conversations with him about this as well, and he is talking again about doing this also, about opening and being transparent about their emissions, so we’re getting some traction now in the space. Finally, Greenqloud, Greenqloud’s CEO is a guy called Eiki and I’m not going to try to pronounce his surname because it’s Icelandic and it’s just completely unpronounceable. Eiki has given me permission here today, to announce on behalf of Greenqloud that Greenqloud, because they are a CloudStack customer or user, and they have this energy on emissions stuff already built-in.

In Q2 of next year, they’re going to contribute their code back into CloudStack. So, for me, I think that’s a serious win because then it gets distributed back out. For me, that was a highlight of my last couple of week’s work, just getting Eiki to agree to in Q2 next year contributing that back into CloudStack.

So, that’s it. That’s me. Adding emissions, metrics and reporting to cloud computing will help reduce emissions. That’s it.

post

Rackspace claims cloud is Green but fails to provide data

Rackspace

Rackspace’s Director of Sustainability Melissa Gray, wrote a piece recently on the Rackspace blog titled The Greenest Computing is Cloud Computing.

Given that Cloud computing’s impact is a topic we cover regularly here on GreenMonk, we were excited to see a cloud provider address this issue, especially when this provider is one we have covered favourably in the past.

However, we were disappointed with the article due to it’s lack of any specific data to prove its case. Here are some quotes from the piece:

Every watt Rackspace uses is tracked — It came from somewhere (a power company, a generator) and it went somewhere (an office, a data center to power a server or power infrastructure).

Great – so how myuch power does Rackspace use, and what are its emissions?

We continually take steps to improve energy efficiency and reduce consumption of other natural resources.

Nice, so how much were Rackspace’s emissions in 2010, how much did you reduce them by in 2011, and what’s your target for 2012?

How much of those emissions were produced by your cloud infrastructure? And how much emissions did you displace by doing so?

We left the following comment on the Rackspace blog – it hasn’t shown up there yet, it is probably stuck in moderation somewhere (obviously they wouldn’t refuse to publish it):

Hi Melissa,

Nice article – well written but I notice you managed to avoid mentioning Rackspace’s emissions anywhere in the piece.

You need to publish some hard data to prove that “the Greenest computing is Cloud computing” – it is not enough just to say so.

If an organisation has an in-house email server, we can relatively easily measure its energy utilisation, and from that calculate its emissions. If it moves to a Rackspace server for the organisation’s email, we now have no way of knowing its emissions. If you are not publishing them, for all we know, their emissions are significantly higher than they were when they were in-house.

If, as you say, “Every watt Rackspace uses is tracked”, then it should be straightforward to report on energy use to your customers (my utility co. can do it). Will Rackspace do this? Or better yet, will Rackspace build this functionality into OpenStack, so all OpenStack users can do this?

Btw, I assume your new data center in Australia was sited based on access to renewables?

We await Rackspace’s response.

Image credit Scott Beale / Laughing Squid

post

Cloud computing’s lack of transparency – an update

SAP co-CEO Jim Hagemann Snabe

We have been talking here on GreenMonk about the lack of transparency from Cloud vendors for some time now, but our persistence is starting to pay off, it appears!

Some recent conversations we’ve had with people in this space are starting to prove very positive.

We’ve had talks with GreenQloud. GreenQloud are based in Iceland, so their electricity is 100% renewable (30% geothermal and 70% hydro). They already measure and report to their customers the carbon footprint of their cloud consumption – so what discussions did we have with them? Well, GreenQloud use the open source CloudStack platform to manage their cloud infrastructure. Given that CloudStack is open source, and we’ve previously suggested that Open Source Cloud Platforms should be hacked for Energy and Emissions reporting, we suggested to GreenQloud that they contribute their code back into the CloudStack project. They were very open to the idea. Watch this space.

We’ve also met with CloudSigma, an IaaS provider based in Switzerland. CloudSigma were very interested when I raised this discussion with them at the GigaOm Structure event in Amsterdam earlier this year and they hope to have energy and emissions reporting ready to demonstrate very soon. In a way though, the discussions with CloudSigma went much as expected. We were after all, preaching to the converted. CloudSigma have a good environmental track record having announced that they are carbon neutral back in June 2010.

And finally, last week at the SapphireNow event in Madrid, we had a discussion about cloud providers lack of transparency with Jim Hagemann Snabe, co-CEO of SAP. Jim is an interesting guy. We’ve been covering SAP events for several years now, and every time we’ve heard Jim get up to speak, within the first few sentences he references resource constraints and sustainability. He drives an electric car. He’s totally bought into being green. He’s also a proponent of transparency. So when we raised the issue of the lack of transparency with Jim, his eyes light up and he got all excited. We had a great conversation on the topic which he concluded by saying “I want SAP to be a leader in this space”.

All very positive stuff, still no actual movement but things appear to be going in the right direction.

Image credits Tom Raftery

post

Why are Salesforce hiding the emissions of their cloud?

Salesforce incorrect carbon data

The lack of transparency from Cloud computing providers is something we have discussed many times on this blog – today we thought we’d highlight an example.

Salesforce dedicates a significant portion of its site to Sustainability and on “Using cloud computing to benefit our environment”. They even have nice calculators and graphs of how Green they are. This all sounds very promising, especially the part where they mention that you can “Reduce your IT emissions by 95%”, so where is the data to back up these claims? Unfortunately, the data is either inaccurate or missing altogether.

For example, Salesforce’s carbon calculator (screen shot above) tells us that if an organisation based in Europe moves its existing IT platform (with 10,000+ users) to the Salesforce cloud, it will reduce its carbon emissions by 87%.

This is highly suspect. Salesforce’s data centers are in the US (over 42% of electricity generated in the US comes from coal) and Singapore where all but 2.6% of electricity comes from petroleum and natural gas [PDF].

On the other hand, if an organisation’s on premise IT platform in Europe is based in France, it is powered roughly 80% by nuclear power which has a very low carbon footprint. If it is based in Spain, Spain generates almost 40% of its power from renewables [PDF]. Any move from there to Salesforce cloud will almost certainly lead to a significant increase in carbon emissions, not a reduction, and certainly not a reduction of 87% as Salesforce’s calculator claims above.

Salesforce incorrect carbon data

Salesforce also has a Daily Carbon Savings page. Where to start?

To begin with, the first time we took a screen shot of this page was on October 1st for slide 26 of this slide deck. The screen shot on the right was taken this morning. As you can see, the “Daily Carbon Savings” data hasn’t updated a single day in the meantime. It is now over two months out-of-date. But that’s probably just because of a glitch which is far down Salesforce’s bug list.

The bigger issue here is that Salesforce is reporting on carbon savings, not on its carbon emissions. Why? We’ve already seen (above) that their calculations around carbon savings are shaky, at best. Why are they not reporting the much more useful metric of carbon emissions? Is it because their calculations of emissions are equally shaky? Or, is it that Salesforce are ashamed of the amount of carbon they are emitting given they have sited their data centers in carbon intensive areas?

We won’t know the answer to these questions until Salesforce finally do start reporting the carbon emissions of its cloud infrastructure. In a meaningful way.

Is that likely to happen? Yes, absolutely.

When? That’s up to Salesforce. They can choose to be a leader in this space, or they can choose to continue to hide behind data obfuscation until they are forced by either regulation, or competitive pressure to publish their emissions.

If we were Salesforce, we’d be looking to lead.

Image credits Tom Raftery

post

CloudApps releases their employee engagement app Sumo

CloudApps SuMo

CloudApps recently released SuMo, their sustainability employee engagement app. The name SuMo comes from the words Sustainability Momentum we’re told, and this is because SuMo was designed to maintain the momentum of an organisation’s sustainability initiative. GreenMonk was given a demo account on SuMo so we could take it for a test drive, and it is a cool little app.

CloudApps sell a suite of sustainability software products for organisations. Their applications sit on top of Salesforce’s Force.com cloud platform, which allows CloudApps to focus on writing the software, and not have to be concerned with maintaining the server infrastructure which runs their programs.

CloudApps solutions already have quite comprehensive capabilities, so it was interesting to see them come out with this employee engagement module.

Pledging a challenge in CloudApps SuMo

The SuMo application works well on mobile devices and it is designed to foster interest and ongoing enthusiasm for sustainability initiatives amongst an organisation’s workforce. It does this by allowing employees to pledge to participate in a number of challenges supplied by the organisation. These challenges are categorised, ranked for difficulty and assigned points.

As employees carry out these challenges (anything from switching from short haul flights, to teleconferencing for their next meeting, to volunteering at a local charity event), they are assigned points and badges, which determines their position on the Leader Board.

Because SuMo sits on Force.com, it can take in data from an organisation’s ERP applications, as well as reporting them back. So initiatives undertaken by employees in SuMo can be reported directly into its back-end systems and the savings accounted for.

CloudApps SuMo adding an idea screen

Also, a nice touch in SuMo is the ability for employees to add new ideas to the site. These ideas can be voted on by colleagues, commented on and favourited. It’s nice to see a bit of social working its way into these kinds of enterprise apps. This will certainly help the app be more engaging and sticky for users. This is something whose importance shouldn’t be underestimated for industries with issues around recruitment and retention.

The user interface has a few little quirks (it is not always as intuitive as it could be), and the app needs to become more social (include Share on Twitter, Share on Facebook, etc. buttons) buttons, but presumably that will all come with time. For a version 1.0 app though this is a creditable effort.

Full disclosure – CloudApps is not a GreenMonk client but CloudApps did give GreenMonk a free 30-day trial SuMo account so we could kick the tires of the app.

Image credits Tom Raftery

post

Can we hack open source #cloud platforms to help reduce emissions?

RedMonk runs two conferences a year – Monki Gras in London in late January/early February and Monktoberfest in Portland, Maine in early October.

At this year’s Monktoberfest I gave a talk titled “Can we hack open source #cloud platforms to help reduce emissions?” to an audience which consisted almost entirely of developers and the feedback I received was consistently positive. The slides for the talk are above and I’ll post the video as soon as it is available, along with a transcription.

My presentation was fairly straightforward – it was a call to action. I first outlined the problem – most cloud computing companies are not publishing data around their energy or (more importantly) their emissions. Those that are, are not publishing it in enough detail, or are publishing the wrong data (carbon saved, as opposed to carbon emitted). I also pointed out that energy use is not a proxy for emissions – the amount of emissions the important metric to track.

Why don’t cloud computing companies disclose their emissions? It is probably a combination of not wanting to give away competitive intelligence, not wanting to be viewed as a polluter, and there being no agreed reporting standards around this area.

Then I pointed out a quick recap of the year 2012 to-date with all of the wildfires, floods, droughts, temperature records, and unprecedented ice loss in the arctic. I know these aren’t solely caused by cloud computing, but it is a significant contributor (estimates from Gartner in 2007 put the amount at 2% of global emissions – and that number is highly likely to have increased since then).

The solution – I proposed a fairly straightforward solution. Hack the currently available open source cloud platforms (Eucalyptus, CloudStack and OpenStack), write emissions measurement and reporting patches. Get the patches accepted back into the core so that when the next update of the software is pushed out, the companies using the three platforms will at a stroke, have energy and reporting capabilities. At that point customer demand should ensure that they make this info public (or at least available to their customers).

I concluded by noting that adding emissions metrics and reporting to cloud computing platforms will reduce emissions – and then asking the audience “Ok, so who’s up for it?”

During the Q&A, Andy Piper rightly pointed out that it would have been appropriate for me to mention the Cleanweb Manifesto in my talk and he was absolutely correct. Next time I give the talk I will point it out and urge people to sign it.

post

Rackspace’s European Cloud really is Green. No Coal Power, All Renewables, Low Carbon Intensity

At GreenMonk we think its important to get under the skin of sustainability assumptions, to try and understand the underlying data, complex though they may be, which is why we have been skeptical of claims by vendors that cloud is by definition green. We are also disappointed by the Carbon Disclosure Project’s position on the subject. We might as well say cloud is by definition secure, or by definition offers 100% uptime. None of these statements stand up to scrutiny. Cloud can be greener, but a lot depends on where the energy to run that cloud comes from. We need to analyse the inputs, as well as the outputs. If you run your cloud on coal then its not green – its dirty cloud.

My colleague Tom does a great job talking to the issues in this video, with transcript.

Tom also points out that the Google Apps cloud has a surprisingly high carbon intensity. Of course sustainability is about more than energy – which cloud providers have published data on water consumption and use?

I met Rackspacee recently to talk about its European business and I was pleased to discover that its European data center, here in the UK, runs on certified 100% renewable power. If only other cloud providers made such clear and unambiguous commitments to sustainability. Well done Rackspace. Now if we can just get the company to be programmatic about sharing data about its performance, to encourage other cloud providers to become more transparent.

update for extra bonus points from the good people over at Mastadon C, a project to enable organisations to choose where to deploy Hadoop jobs based on the carbon intensity of a chosen data center location. On Mastadon C’s blog today they also commend Rackspace, confirming GreenMonk’s position, also supported by Greenpeace.

“So Rackspace London rocket up the leaderboard as a green option, and we can build moar big data in the UK without doing bad things to the planet! Happy campers all round.”

post

Cloud Computing: Google Apps cloud has a relatively high carbon intensity

Cloud

I have been researching and publishing on Cloud Computing for quite some time here. Specifically, I’ve been highlighting how it is not possible to know if Cloud computing is truly sustainable because none of the significant Cloud providers are publishing sufficient data about their energy consumption, carbon emissions and water use. It is not enough to simply state total power consumed, because different power sources can be more, or less sustainable – a data center run primarily on renewables is far less carbon intensive than one that relies on power from an energy supplier relying on coal burning power stations.

At Greenmonk we believe it’s important to get behind the headline numbers to work out what’s really going on. We feel it’s unacceptable to simply state that Cloud is green and leave it at that, which is why we’ve been somewhat disappointed by recent work in the field by the Carbon Disclosure Project. We would like to see more rigour applied by CDP in its carbon analytics.

Carbon intensity should be a key measure, and we need to start buying power from the right source, not just the cheapest source.

I was pleasantly surprised then yesterday when I heard that Google had published a case study ostensibly proving that Cloud had reduced the carbon footprint of at least one major account.

However, it is never that straightforward, is it?

The Google announcement came in the form of a blog post titled Energy Efficiency in the Cloud, written by Google’s SVP for Technical Infrastructure, Urs Hölzle. I know Urs, I’ve met him a couple of times, he’s a good guy.

Unfortunately, in his posting he heavily references the Carbon Disclosure Project’s flawed report on Cloud Computing, somewhat lessening the impact of his argument.

Urs claims that in a rollout of Google Apps for Government for the US General Services Administration,

the GSA was able to reduce server energy consumption by nearly 90% and carbon emissions by 85%.

An 85% reduction in carbon emissions sounds very impressive – but how does Google calculate that figure? Also worth considering is the age of the server estate – any data center that decommissions older servers in favour of new ones is likely to see an efficiency bump. Assuming the GSA servers running Microsoft apps were more than five years old, they would have seen a considerable efficiency bump simply by running the apps on new servers, on premise or off. Without disappearing down a rathole, its also worth noting cradle to cradle factors in server manufacturing – supply chains consume carbon.

We looked at a whitepaper titled Google Apps: Energy Efficiency in the Cloud [PDF], where the search company shares some of the methodology behind the blog post. We would like to see a lot more detail about assumptions and methods.

The key reference to how Google calculated carbon emissions is this line:
The following summary tallies up every GSA server dedicated to email and collaboration across 14 locations in the continental U.S. and applies the appropriate PUEs, electricity prices, and carbon intensities for each location

Here’s the table:
Google Apps GSA case study

The data in the table above is interesting but if you look at the carbon information, you start to notice something strange – here’s a slightly different view on Google’s data:

Google Apps carbon intensity

While it is no real surprise that Google’s servers produce less CO2 per annum than the GSA’s (4.75 vs 7.69 tons), what is very surprising (to me at least) is the fact that Google’s facilities are significantly more carbon intensive than the GSA’s were (14.5 vs 10.63 tons of CO2 per kWh).

In simple terms, carbon intensity is a measure of the amount of CO2 released in the generation of electricity. The data above, clearly show that the data centres hosting the Google Apps Cloud are not optimised for reduced emissions (the best way for data centers to optimise for reduced emissions is to source electricity generated from renewable sources).

I guess the good news is that, while Google has helped the GSA to reduce its carbon emissions, there’s plenty of room for improvement!

I reached out to Urs for a response to this and because he’s traveling at the minute, the only answer I received pointed out that since 2007 Google’s net emissions are zero. And, in fairness to Google, they do fund some worthwhile offsetting projects, as you can see in the video below (check out the farmer towards the end, he’s just awesome!).

Cloud photo credit mnsc

post

Use open source platforms to find cloud computing’s energy and emissions footprint

Dials

Regular GreenMonk readers will be very aware that I am deeply skeptical about claims that Cloud Computing is Green (or even energy efficient). And that I talk about the significant carbon, water and biodiversity effects cloud computing can have.

One of the biggest issues with any claims of Cloud Computing being energy efficient, or Green, is the lack of transparency from the Cloud Computing providers. None Almost none of them are publishing any data around the energy consumption, or emissions of their Cloud infrastructure (article updated from “None of them” to “Almost none of them…” after comments from Memset and Greenqloud in the comments section below). Without data to back them up, any claims of Cloud computing being efficient are worthless.

Last week, while at the RackSpace EMEA Analyst day, we were given a potted history of OpenStack, RackSpace’s Cloud Computing platform. OpenStack was jointly developed by NASA and RackSpace and they open-sourced it with an Apache License in July 2010.

Anyone can download OpenStack and use it to create and host Cloud Computing solutions. Prominent OpenStack users include NASA, RackSpace (not surprisingly), AT&T, Deutsche Telecom, HP and IBM.

What has this got to do with Cloud Computing and energy efficiency I hear you ask?

Well, it occurred to me, during the analyst day, that because OpenStack is open source, anyone can fork it and write a version with built-in energy and emissions reporting. What would be really cool is, if this functionality, having been written, became a part of the core distribution – then anyone deploying OpenStack, would have this functionality by default.

And, OpenStack isn’t the only open source Cloud platform – there are two others that I’m aware of – Citrix’s CloudStack and Eucalyptus. Having the software written for one open-source platform, should allow reasonably easy porting to the other two.

Of course, with the software written as open-source, there could be constant improvement of it. And as part of one of the cloud platforms, it should achieve widespread distribution quickly.

Having energy and emissions information available, will also allow inefficiencies in Cloud infrastructure to be quickly identified and fixed.

So, the next step is to get someone to write the software – anyone up for it?

Or, what are the chances of getting someone like HP, IBM, RackSpace, or even NASA to sponsor a hackathon whose aim is to develop such software?

Photo Credit Jeremy Burgin

post

Efficiency and Ecological Responsibility of Cloud Computing (including water footprint)

A BrightTALK Channel

Unfortunately the provider for this webinar requires a login to listen to this discussion. If you don’t wish to register, my username is [email protected] and my password is 000000

Mark Thiele from Switch recently invited me to participate in a webinar he was moderating on the Efficiency and Ecological Responsibility of Cloud Computing which took place yesterday evening.

Also participating in the discussion were Harkeeret Singh (aka Harqs) Global Head of Energy & Sustainable IT at Thomson Reuters and Jason Hoffman CTO and Founder of Joyent.

The discussion started off asking whether or not cloud computing is efficient and the panel was fairly unanimous in deciding that cloud computing is not efficient. The main point I made here is that because cloud providers are not publishing energy information, it is not possible to say whether or not cloud computing is energy efficient.

At around 15 minutes into the conversation, we shifted on to asking whether or not cloud computing is green. There was a good discussion on this with the fact that efficiency not necessarily being green being one of the main points raised. Also brought up was how plummeting costs of cloud computing are leading to an explosion in consumption – in itself not very green. And as a counterpoint Harqs raised the fact that lower costs are beneficial to start-ups in developing countries.

Then 33 minutes into the conversation, we started discussing the impacts on water of cloud computing. One point I raised is that if you run a 25kW rack for one hour the water footprint from electricity productions is:

  • 0.1 litres if the electricity comes from wind
  • 2.5 litres if the electricity comes from solar
  • 45 litres if the electricity comes from coal and
  • 55 litres if the electricity comes from nuclear (and this doesn’t include the considerable water footprint of uranium mining).

Nuclear power plants use phenomenal amounts of water. From the Union of Concerned Scientists report [PDF] on this

the typical 1,000 Mwe nuclear power reactor with a 30oF ?T needs approximately 476,500 gallons per minute. If the temperature rise is limited to 20oF, the cooling water need rises to 714,750 gallons per minute. Some of the new nuclear reactors being considered are rated at 1,600 Mwe. Such a reactor, if built and operated, would need nearly 1,144,000 gallons per minute of once-through cooling for a 20 degree temperature rise.

Actual circulating water system flow rates in once-through cooling systems are 504,000 gpm at Millstone Unit 2 (CT); 918,000 gpm at Millstone Unit 3 (CT); 460,000 gpm at Oyster Creek (NJ); 311,000 at Pilgrim (MA); and 1,100,000 gpm at each of the twp Salem reactors (NJ).

And that level of water consumption has big biodiversity effects – imagine the large water intakes required for a nuclear plant taking in one million gallons of water per minute. These water intakes don’t just take in water, they also take in any life forms in that water. None of these life forms survive going through a nuclear power plant obviously. And then there’s the heat pollution effects from the warmer water coming from the power plant outlets.

Towards the end of the discussion Jason asked if making this data available to end users would be a clear differentiator for Joyent. I responded that it would be because a) there is a demand for this information and b) because having seen how Greenpeace successfully went after Facebook, (and in their latest report are now targeting Apple, Amazon and Microsoft) for their dis-regard for the footprint of their cloud computing infrastructure, nobody wants to be the next company in Greenpeace’s sights.

Harqs added that any company pursuing such a policy should open-source it so everyone could contribute to the development of constantly improving reporting standards.

The highlight of the webinar for me was at 47:30 when Jason committed to doing just that.

All in all a superb discussion with a fantastic outcome. I hope you enjoyed it as much as I did.