post

IBM acquires Weather.com for Cloud, AI (aaS), and IoT

Raindrops keep falling...

IBM has announced the completion of the acquisition The Weather Company’s B2B, mobile and cloud-based web-properties, weather.com, Weather Underground, The Weather Company brand and WSI, its global business-to-business brand.
Weather Channel screenshot
At first blush this may not seem like an obvious pairing, but the Weather Company’s products are not just their free apps for your smartphone, they have specialised products for the media industry, the insurance industry, energy and utilities, government, and even retail. All of these verticals would be traditional IBM customers.

Then when you factor in that the Weather Company’s cloud platform takes in over 100 Gbytes per day of information from 2.2 billion weather forecast locations and produces over 300 Gbytes of added products for its customers, it quickly becomes obvious that the Weather Company’s platform is highly optimised for Big Data, and the internet of Things.

This platform will now serve as a backbone for IBM’s Watson IoT.

Watson you will remember, is IBM’s natural language processing and machine learning platform which famously took on and beat two former champions on the quiz show Jeopardy. Since then, IBM have opened up APIs to Watson, to allow developers add cognitive computing features to their apps, and more recently IBM announced Watson IoT Cloud “to extend the power of cognitive computing to the billions of connected devices, sensors and systems that comprise the IoT”.

Given Watson’s relentless moves to cloud and IoT, this acquisition starts to make a lot of sense.

IBM further announced that it will use its network of cloud data centres to expand Weather.com into five new markets including China, India, Brazil, Mexico and Japan, “with the goal of increasing its global user base by hundreds of millions over the next three years”.

With Watson’s deep learning abilities, and all that weather data, one wonders if IBM will be in a position to help scientists researching climate change. At the very least it will help the rest of us be prepared for its consequences.

New developments in AI and deep learning are being announced virtually weekly now by Microsoft, Google and Facebook, amongst others. This is a space which it is safe to say, will completely transform how we interact with computers and data.

post

IBM’s InterConnect 2015, the good and the not so good

IBM InterConnect 2015

IBM invited me to attend their Cloud and Mobile Conference InterConnect 2015 last week.

Because of what IBM has done globally to help people get access to safe water, to help with solar forecasting, and to help deliver better outcomes in healthcare, for example, I tend to have a very positive attitude towards IBM.

So I ventured to the conference with high hopes of what I was going to learn there. and for the most part I wasn’t disappointed. IBM had some very interesting announcements, more on which later.

However, there is one area where IBM has dropped the ball badly – their Cloud Services Division, Softlayer.

IBM have traditionally been a model corporate citizen when it comes to reporting and transparency. They publish annual Corporate Responsibility reports with environmental, energy and emissions data going all the way back to 2002.

However, as noted here previously, when it comes to cloud computing, IBM appear to be pursuing the Amazon model of radical opaqueness. They refuse to publish any data about the energy or emissions associated with their cloud computing platform. This is a retrograde step, and one they may come to regret.

Instead of blindly copying Amazon’s strategy of non-reporting, shouldn’t IBM be embracing the approach of their new best buddies Apple? Apple, fed up of being Greenpeace’d, and seemingly genuinely wanting to leave the world a better place, hired the former head of the EPA, Lisa Jackson to head up its environmental initiatives, and hasn’t looked back.

Apple’s reporting on its cloud infrastructure energy and emissions, on its supply chain [PDF], and on its products complete life cycle analysis, is second to none.

This was made more stark for me because while at InterConnect, I read IBM’s latest cloud announcement about their spending $1.2bn to develop 5 new SoftLayer data centres in the last four months. While I was reading that, I saw Apple’s announcement that they were spending €1.7bn to develop two fully renewably powered data centres in Europe, and I realised there was no mention whatsoever of renewables anywhere in the IBM announcement.

GreenQloud Dashboard

Even better than Apple though, are the Icelandic cloud computing company GreenQloud. GreenQloud host most of their infrastructure out of Iceland, (Iceland’s electricity is generated 100% by renewable sources – 70% hydro and 30% geothermal), and the remainder out of the Digital Fortress data center in Seattle, which runs on 95% renewable energy. Better again though, GreenQloud gives each customer a dashboard with the total energy that customer has consumed and the amount of CO2 they have saved.

This is the kind of cloud leadership you expect from a company with a long tradition of openness, and the big data and analytics chops that IBM has. Now this would be A New Way to Think for IBM.

But, it’s not all bad news, as I mentioned at the outset.

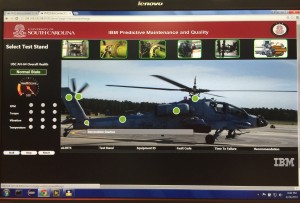
IBM Predictive Maintenance

As you’d expect, there was a lot of talk at InterConnect about the Internet of Things (IoT). Chris O’Connor, IBM’s general manager of IoT, in IBM’s new IoT division, was keen to emphasise that despite the wild hype surrounding IoT at the moment, there’s a lot of business value to be had there too. There was a lot of talk about IBM’s Predictive Maintenance and Quality solutions, for example, which are a natural outcome of IBM’s IoT initiatives. IBM has been doing IoT for years, it just hasn’t always called it that.

And when you combine IBM’s deep expertise in Energy and Utilities, with its knowledge of IoT, you have an opportunity to create truly Smart Grids, not to mention the opportunities around connected cities.

In fact, IoT plays right into the instrumented, interconnected and intelligent Smarter Planet mantra that IBM has been talking for some time now, so I’m excited to see where IBM go with this.

Fun times ahead.

Disclosure – IBM paid my travel and accommodation for me to attend InterConnect.

post

Tips for starting out coding for the Internet of Things

We attended the SAP TechEd && d-code events recently. One of the more interesting parts of the showfloor was the Internet of Things (IoT) area. In this area there were demos of Internet of Things technologies currently in use by the likes of port of Hamburg, SK Solutions intelligent crane solutions (of which, we’ll be publishing a video in a subsequent post), and Internet connected vending machines, amongst other displays.

Even more interesting than the demos though was the IoT hacking area. In this area, SAP staff worked to create interesting Internet of Things connected devices, and there were machines available with Arduino, Tessel, and Beaglebone microcontrollers and instructions on how to connect them to sensors, pull data from the sensors, and push that data up to the Hana Cloud Platform.

In the Las Vegas event the SAP staff created the scarecrow seen in the video above. This scarecrow would flash the LEDs in its eyes, move its head, move its arms, and fire a Nerf gun when commanded to do so over Twitter. In the slo-mo video above, it does all the actions at once. Apologies for the quality of the video, it was shot using a smartphone lying prone on the floor.

We spoke to SAP’s Craig Cmehil subsequently to get hints on how to start out learning about hacking Internet of Things projects at home and he supplied us with a list of resources.

Craig recommended getting started with one of the following kits:

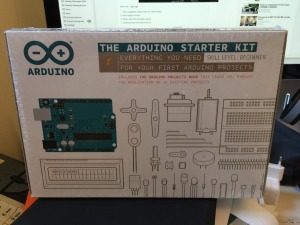
For Arduino

While for Raspberry Pi there’s

The links above are direct links to these items on Amazon, and there are many more accessories available on the Sparkfun site.


Not sure what the differences are between an Arduino and a Raspberry Pi? Check out this great explainer on Read Write Web.

Now, having decided on your IoT platform, what about some good resources, well,

Arduino Starter Kit

  • if you are planning to include your kids in the process, then Raspberry Pi kid is a good blog to check out
  • Coder for Raspberry Pi is an open source project to teach kids how to build websites using the Raspberry Pi
  • Adafruit has some great lessons on coding for Raspberry Pi, like this one for temperature sensing
  • Adafruit also has lots for Arduino
  • The Arduino site has lots of resources available for all levels of learner

And if you are wondering about connecting these devices to the cloud, Rui Nogueira has a great two piece blog post with detailed instructions for Raspberry Pi here.

If hacking microcontrollers is your thing, or you think it could be, then our ThingMonk event next week in the UK is the place to be. It is a three day event with day one being hacking, day two is IoT tech talks, and day three (called Business of IoT) is business related IoT talks.

post

Internet of Things connected Philips Hue bulbs review

After we wrote a post about the Lifx, Internet of Things connected LED lights a few weeks back, we reached out to Philips to see if we could get a Philips Hue kit to try out for comparison. Philips obliged and sent us a kit which contains 3 LED lights, and a Hue bridge.

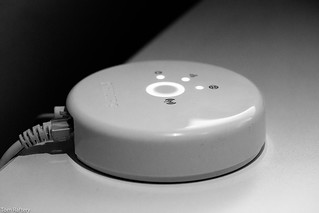
Philips Hue bridge

Philips Hue bridge

As a bit of background, the way the Philips Hue system works is that you receive a device called a bridge with your bulbs which you need connect into your internet router. This device talks to the Philips Hue bulbs over the ZigBee protocol, and also is capable of connecting to the Internet via your router. Thus your Philips Hue bulbs are capable of being controlled not just from inside your home, but also from outside the home using the free Philips Hue smartphone app (available for both Android and iOS).

The smartphone app has a lot of extra functionality built-in. The app enables users:

  • to change the colour of the light coming from the bulbs (across the full spectrum of visible light), as well as the intensity
  • to use pre-built recipes which come with the app for different light intensities and colours. These recipes are editable, and owners can create their own recipes and share them with the Hue community
  • set-up Geofencing, so it’s possible to have the lights automatically go off when you leave home, and come on when you approach home
  • create alarms such that the lights simulate a sunrise early in the morning, or a sunset late at night. The sunrise functionality can be especially useful if you find it hard to awake on dark winter mornings
  • to control lights remotely – this is useful if you don’t use the geofencing functionality and you want to check if you turned the lights off after you go out, or if you don’t want to enter a dark home
Philips Hue Bridge Power consumption

Philips Hue Bridge Power consumption

The bulbs, as can be seen in the video give out good light (600 Lumen at full intensity) over a large range of colours, and using very little electricity. Typical consumption, at full intensity, and a colour temperature of around 3000K, is 5W. However, the bulbs also draw a constant 0.4W when they are turned off by the app (as opposed to being turned off at the physical switch). This is so they can maintain their Zigbee connection to the bridge, in order to be able to come respond to the smartphone app (alarms, remote on/off requests, geofencing, etc.). And the bridge itself consumes a constant 1.6W, so the three bulbs, plus the bridge, have a baseline consumption of 2.8W.

When you compare the 2.8W to 60W from a conventional incandescent bulb, it doesn’t appear to be a huge draw, but over 24 hours it does add up (it is the equivalent of leaving a 60W bulb on for a little over an hour and seven minutes per day).

To avoid burning the constant 2.8W you can of course turn the bulbs off at the wall (or the switch). Then they are no longer in ‘listening mode’ and consume 0W, instead of the constant 0.4W. In this scenario, the electricity draw is reduced to just the 1.6W from the bridge. Over 24 hours this is equivalent to leaving a 60W bulb on for just over 38 minutes. The advantage of this approach is lower electricity consumption, the disadvantage is that the Hue bulbs are no longer connected to the Internet of Things.

This constant nibbling of power by the Hue devices is by no means unique to Philips. By definition any devices constantly connected to the Internet are also constantly consuming power – which raises interesting questions around the costs and benefits of Internet of Things connected devices.

post

People as Sensors – mining social media for meaningful information

I gave a talk at our recent ThingMonk, Internet of Things conference in London which I titled People as Sensors – mining Social Media for Good. The talk was principally about the many use cases where the firehose that is social media can now be analysed in realtime, and real, meaningful information can be extracted from it.

Feedback on the talk was extremely positive, so I said I’d post the video here.

Here’s the transcript of my talk:

Thanks very much! People As Sensors, it’s the idea of mining social media for useful information.

Obviously we have heard about the difference between data and information this morning, so we are just going to power through a little bit about that.

This slide deck is already up on SlideShare, so anyone wants to have a look at it, it’s there. I have my notes published, my notes for the slides published with the slides on SlideShare, so if you want to download it, you will get the notes there as well.

So mobile data; every one of us has got one of these little devices, and it’s publishing, not just the information that we publish ourselves, but also a lot of other information as well.

And this was brought home to us in 2009 very clearly when a german politician called Malte Spitz sued Deutsche Telecom because of the data retention laws in Germany that had just been legislated and he asked them for his data, he wanted the six months of data that they had on retention for him.

Can I get a show of hands here for anyone who has not heard the story already? Okay, a good few people haven’t.

So I will just break out of the presentation for a second, because — if I can; apparently it doesn’t want to. Okay, I will just — no, it doesn’t want to. What he did was he published the information in ZEIT ONLINE, and the link is at the bottom there, and all these screens that I have, all these slides that I have, they have a link at the bottom, it’s a clickable link; it’s a clickable link in the PDF on the SlideShare as well, so you can go and you can view this data.

There is a Play bottom in the bottom left there. You can hit Play on that button on the site and you can go through the six months of his life and it plays where he goes.

So when he gets on the train, the little dot there moves along the map, so you can see where he was for almost all the time of that six months. It lights up a little mobile phone icon when he is on the phone, when he is making a phone call or sending texts.

You can see where he sleeps, you can see when he sleeps, you can see when he gets up, it’s all there, and it’s all beautifully visualized. And when you see something as stark as that you suddenly realize, Jesus, we are really publishing a lot of information, aren’t we?

And it’s not just that kind of information; we are publishing a load of stuff in social medial as well. So you just take a quick look at some of the numbers in social media and you realize how big it is. Facebook have announced now that they have got 1.2 billion users and the latest numbers that they published in August, they talk about 4.5 billion likes per month, 4.75 billion items published — oh no, that’s per day. 4.5 billion likes per day, 4.75 billion items published per day, and I have forgotten how many billion photographs. It’s just insane.

Twitter, this is a typical diurnal graph of Twitter tweets per second. So you are starting at kind of midnight on the left, you are going across through the morning. It peaks at around — okay, over there it peaks at around 8,000, a little over 8,000, dips again mid-afternoon, picks up, and then drops off at nighttime. That’s daily.

The average number of tweets they say it’s around 6,000 tweets per second, and this is tweets per day over a 365 day period. You can see 400,000 going up to around 600,000 tweets per day now.

And Twitter are actually selling this data. They announced in their filing for the IPO that they have made about 47.5 million, which is quite modest I would have thought, selling direct access to their data. So people who buy their data from them house their servers in the same complex as the Twitter servers and get direct access to all the tweets that have been published instantaneously so they can mine it there and then.

So it’s not just Twitter, it’s not just Facebook, you have got Google+ talking about 500 million users, 300 million in the stream.

Sina Weibo; we are talking about 500 million users and growing. And you have got other networks as well; Waze, which was recently bought by Google, is a GPS application, which is great, but it’s a community one as well. So you go in and you join it and you publish where you are, you plot routes.

If there are accidents on route, or if there is police checkpoints on route, or speed cameras, or hazards, you can click to publish those as well. It’s a very simple interface, so that it doesn’t interfere with your driving, or it’s minimal interference with your driving. And I will come back to why that’s interesting in a few minutes.

And I am rushing through this because I have got 50 something slides and James wants me to do it in 15 minutes. So here are some of the use cases from all that data, and there are some nice ones out there. A lot of you are probably familiar with this one; it’s the UK snow meteorology example. It was one that was put up a couple of years back and it has been used every year every time there is snow in the UK.

There is a little dash of snow over London there in this screenshot, because there wasn’t one when I went to the site, so I tweeted about it, and got a bit of snow to fall on EC 2 there.

Utility companies are starting to use social media increasingly for outage management. So GE have got this Grid Insight Application, and what they do is if a utility company has an outage in their area, they can look for mentions of the outage on social media channels. And in this picture here you see someone has tweeted a photograph of a tree, which is after taking down an electricity line, so not they have a good idea of what the issue is.

This is in real time. So instead of having to send out an investigatory truck roll, they just send out the vegetation truck roll, and that cuts down massively on the time to get the outage fixed and get people back live again.

And this is another one, you can see here there is a fire in the substation, and it’s right beside a road, and you can see a cluster of Twitter — maybe not, you would have to look closely, but those are the blue dots there, those are little clusters of tweets and Facebook posts, and you have got a Facebook video posted of the fire in the substation.

Other things; the United Nations Development Project are analyzing in real time social media. This is the project they ran to analyze social media, because they want to know when there are likely risks to their people on the ground.

This is one they did in Georgia around the time of the upset between Georgia and South Ossetia in 2008-2009. So they looked at the mentions there and they graphed it versus when the trouble actually happened. So now they are building a model so they can call their people and say, okay, look, it has gotten to the point where it’s getting risky for you guys to be in there, we need to get you out now.

Automotive; the automotive industry are starting to use this. There was an application developed by the Pamplin College in University of Virginia Tech where they started mining social media for mentions of particular, what they call, smoke terms. These were terms which are important for the automobile industry and so they can identify quickly when faults come in cars.

This is a much faster way of reporting faults back to the manufacturer rather than going back up to the dealer network, which can take weeks and months. If they are getting it directly from the consumers, they get it faster, they do the recall faster, and you have got safety issues there, you are saving people’s lives. Plus, you are also having to recall fewer cars because few of them have been sold by the time the issue comes to life.

In the finance industry; this is a paper that was published. It was published in, I think it was 2009, and it said that Twitter can predict the stock market with 87% accuracy, and again, the link is at the bottom, you can click through and read the paper.

So on the back of that this UK crowd called Derwent Capital Management licensed the technology and set up a fund, and it has now become Cayman Atlantic, and they are doing quite well apparently. And there are several other companies who are doing similar now as well, using Twitter to predict the stock market.

In law enforcement social media is huge, it’s absolutely huge. A lot of the police forces now are actively mining Facebook and Twitter for different things. Like some of them are doing it for gang structures, using people’s social graph to determine gang structures. They also do it for alibis. All my tweets are geo-stamped, or almost all, I turned it off this morning because I was running out of battery, but almost all my tweets are geo-stamped. So that’s a nice alibi for me if I am not doing anything wrong.

But similarly, it’s a way for authorities to know where you were if there is an issue that you might be involved in, or not. So that’s one.

They also use it for interacting with people. They set up fake profiles and interact with suspects as well and try and get them to admit and all that kind of stuff.

I have a few extra slides hidden here, because James asked me to crunch this down. If you do download it, you will get all the sides there, and they are some very interesting ones. If you have an interest in the law enforcement angle, there are some great case studies that you can look into there.

Obviously the law enforcement one is one you have got to be very careful of, because you have issues there around the whole Minority Report and Precrime, and it’s more of a dodgy one than many of the other ones I have been talking about.

Smart cities; we heard people talking about smart cities this morning. This is the City of Boston and they have got their citizens connect to application, and that allows people with a smartphone, and it’s agnostic; it can be Android, iOS, I am not sure if they do BlackBerry, but Android and iOS are covered anyway. You can report potholes, street lights, graffiti, sidewalk patches, whatever those are, and damage signs and others.

You get reports back when you report something to the City of Boston, and a couple of other cities are rolling these out as well, but in this particular one, when you report an issue to the City of Boston, you get a communication back from the city telling you who is assigned to fix that particular item you have reported. And then that person contacts you to say when they have done it, and often they will photograph it and you get a photograph of the item you have reported having been fixed by the named person who has done it. So very smart.

Healthcare; healthcare is a big one as well. You are probably familiar with Google Trends and Google Flu Trends, so Google Flu Trends, they take the search data to predict when there are likely flu outbreaks.

Well, they went a step further and they funded this paper, which was published in the American Journal of Tropical Medicine and Hygiene, and what they did was they looked at the data, the social media data for mentions of cholera and cholera symptoms in Haiti in 2010 after the earthquake there. And they found that the mentions of cholera and cholera symptoms on social media tracked exactly with the governmental data, so it was an exact match. The only difference being it was two weeks ahead of the government data.

So you can imagine two weeks on a cholera outbreak, the number of lives you could save, so really important stuff.

There is also this fantastic application which was called Asthmapolis and is now called Propeller Health. And what that is, it’s a little device that sits on top of an inhaler, so when you give a puff on your inhaler, it reports it with GPS and timestamp.

So when you go to your doctor, your doctor then can see a map of where and when you puffed on your inhaler, and you get to see it as well. So you start to see patterns in when you used your inhaler.

So you might say every time I visit my friend’s house, I use the inhaler more. They are a smoker. Okay, so now I need to be aware.

Or every time I am on my way to work, when I pass this particular place I use the inhaler, maybe I should take a different route.

But it goes a step beyond that as well. They have gotten the City of Louisville, in Kentucky to roll this out to all their asthma people. And they have a particular issue with pollution in Louisville, because there is a 13 year lifespan difference in people’s expected lifespan depending on where they live in Louisville.

So you live in one place, you live 13 years less than your neighbors. So they are using this application to try and help them identify and to try and help them clean up the City of Louisville, so a really interesting application there.

In CRM, Customer Relationship Management, it was T-Mobile in the U.S. who went through the millions of customer records they had, they went through their billing records, they went through mentions in social media. They had, I think it was 33 million customers, and they were losing customers all over the place.

When they started analyzing the social media mentions, matched it up with the billing records, etcetera, and they started taking preventative action for people they identified as likely to defect, they halved their defections in three months.

So they cut down on their customer defections, in three months they cut them down by 50%. Amazing!

Brand management; a couple of years ago Nestlé got Greenpeace. They were sourcing palm oil for making their confectionary from unsustainable sources, from — Sinar Mas was the name of the company and they were deforesting Indonesia to make the palm oil.

So Greenpeace put up a very effective viral video campaign to highlight this, and this actually had an impact on Nestlé’s stock price, short-term, small impact, but it had an impact on their stock price, as well as the reputational issues.

Nestlé put in place a Digital Acceleration Team who monitor very closely now mentions of Nestlé online and as a result of that this year, for the first time ever, Nestlé are in the top ten companies in the world in the Reputation Institute’s Repute Track Metric. So they are now considered globally as one of the more reputable industries, at least partly as a result of this.

In transportation; I mentioned Waze earlier. So Google Maps have now started to incorporate data from Waze. So right here you can see a screenshot of someone’s Google Maps and it’s highlighting that there was an accident reported on this particular road via Waze, via the Waze App. So that’s really impressive, you are on your Google Maps and now you are notified ahead of time that there has been an accident up the road, you have a chance to reroute.

Also in transportation, this is a lovely little example; Orange in the Ivory Coast, they took, I think it was — I have it noted here somewhere, 5 million Orange users, 2.5 billion anonymized records from their data.

Anonymized released it and said, okay, let’s see what you can do with this anonymized data from our customers. There is a competition. The best use was where they remapped the country’s public transport because they could see looking at people’s mobile phone records where people were going during the day.

So they said, okay, people are going from here to here, but our bus route goes from here to here, to here, to here, let’s redraw the bus route this way where people actually want to go. Simple! Beautiful application of data, the data that we all published all the time, to make people’s lives easier. They reckon they saved the first 10% of people’s commute times.

Looking ahead, and I am wrapping up here James, wherever he is, you have got things like Google Glass, which will now be publishing people’s data as well.

You have got this thing called Instabeat, and what it is, it’s like Google Glass for swimmers. So it has got a little display inside people’s goggles as they are swimming, so they can see how fast their heart rate is; they can see several of the kind of things that you want when you are a competitive swimmer and you are trying to up your game.

And you have got all the usual stuff that we are all aware of, the Jawbones and all these other things that people are using to track their fitness.

More and more we are being quantified, we are generating more and more data, and it’s going to be really interesting to see the applications that come from this data.

So the conclusion from all of this very quickly, data and the data sources are increasing exponentially, let’s go hack that data for good.

Thank you!

post

9 things you need to know about Lifx’s Internet of Things connected LED light

Philips 12W CFL bulb

Back in September 2012 I saw a Kickstarter campaign entitled LIFX: The Light Bulb Reinvented. The campaign promised to deliver

a WiFi enabled, multi-color, energy efficient LED light bulb that you control with your iPhone or Android

This sounded great. Energy efficient, LED bulbs which could change colour to match/create moods, and which you could control from your Smartphone? Where do I sign up? Well, I signed up on the Kickstarter page, obviously.

This morning, the Lifx bulbs I bought were delivered, so I decided to put them to the test.

The photo at the top of this post is of a lamp in my home powered by a 12W Philips CFL bulb. I swapped out the CFL for the Lifx LED bulb and I was immediately impressed with how quickly it lit up and how bright it is.

Here’s a comparison of the same lamp with first the CFL bulb, and then the Lifx LED bulb:

Both lamps side by side

The photos were taken with identical camera settings* but look different due to the different brightness of the lights, and the different colour of their light. The lamp on the left is being lit by the Philips 12W CFL bulb, while the lamp on the right is being lit by the Lifx 17W LED wifi connected bulb.

A few comments in favour of the LED light –

  1. While it may look like the CFL bulb is brighter, in fact, that’s because most of its light is aimed downwards, while the LED bulb’s light is beamed upwards away from the table. In fact, the LED bulb is considerably brighter
  2. While not obvious from these photos, the LED bulb lights up instantaneously, whereas the CFL takes a good minute to come to full brightness
  3. The CFL is one colour, but the LED is whatever colour you set it to and
  4. The LED can be controlled from its Smartphone app over wifi
  5.   
    On the other hand –

    Side by side comparison of CFL and Lifx LED bulbs

  6. The LED bulb is much bigger and heavier than the CFL bulb (this may, or may not be an issue for you)
  7. The LED bulb generates a LOT of heat
  8. The LED bulb, when turned off by the app, still consumes 2.7W of electricity (maintaining wifi so it can be turned on again presumably). To avoid this, it needs to be physically turned off at the switch.
  9. The LED bulb is expensive ($89 in the Lifx store) and
  10. Unfortunately the Lifx bulb is not remotely accessible – you need to be connected to wifi to turn it on or off, so if you’re out and realise you’ve forgotten to turn your lights off, there’s no way to turn them off from your smartphone (unless the very cool Revolv app starts to support Lifx bulbs).
  11.   
    And one more bonus thing you need to know (added after I was alerted to this by Andy Piper and I confirmed it as an issue with my Lifx bulbs)

  12. If you switch the Lifx bulb off at the wall, the bulb forgets its previous setting i.e. if you like a warm yellow light, and set it to that colour, as soon as you turn it off at the wall, it reverts to its default bright white on turning on again.

Bottom line – the Lifx bulb is a nice little bulb and a great job by its developers for a v1.0 of their first product. Having said that, its main competitor seems to be the Philips Hue series of wifi connectable, colour variable, smartphone controllable bulbs, and they’re for sale on Amazon.com for $59.97 which is far cheaper than the Lifx at $89. Also, Revolv support the Hue series of bulbs, so it is likely they are remotely controllable. Given that, unless Lifx addresses particularly the cost issue, I’d have to advise anyone interested in Internet of Things connected lighting to look at the Philips solution instead. If I get my hands on the Philips bulbs, I’ll review them here subsequently.

One final note, the Philips CFL bulb rated at 12W was actually drawing 13.5W, while the Lifx bulb rated at 17W was drawing between 17W and 18W.

*Both photos were taken with the camera on full manual mode with shutter speed at 50, ISO at 200, aperture at 4.5, and white balance set for fluorescent light (4000k approx).

post

Internet of things, wind turbines and ThingMonk the conference.

Back in 2009 I remember attending Logica’s analyst day in Lisbon and being very impressed with their Renewables Management System (RMS) – a windfarm management desktop application which was at the time managing a live feed of 300-400 data points from 2,000 wind turbines all over the Iberian peninsula.

Logica has since gone through a merger/acquisition process and is now known as CGI. I’m not sure what the status of their RMS solution is now, but I was reminded of it when I attended SAP TechEd in Las Vegas recently.

At the event SAP’s Benjamin Wesson gave me a demonstration of an internet of things (IoT) solution SAP have developed. The demo app, as can be seen in the video above, showcases how a windfarm manager can manage remote (even offshore) windturbines, see the status of any errors, create/manage trouble tickets, see schematics, and deploy resources based on proximity and availability. All from a tablet.

As we head into an era where more and more devices are being connected to the Internet, creating this Internet of Things, we enter a time when we can interact with and control everything from large offshore windfarms, to light switches in our home, from our device of choice (computer, tablet, smartphone).

The implications of this are still far from clear, but it is plain to see that apart from the legitimate security and privacy concerns, the ability to measure and take charge of equipment at all times from wherever has massive potential ramifications for efficiency. Everything from “Did I leave the light on?”, to, “Do I need to alter the angle of that blade on that 6MW wind turbine in the North Atlantic?” can now be asked and answered from the screen of your device of choice.

If you want to learn more about the Internet of Things, I recommend you head along to our ThingMonk conference in London on Dec 3rd next. Benjamin Wesson will be speaking there, as will some other awesome speakers, and there’ll be great demo’s as well.

And if you can’t make it along, we plan to video as many of the talks as possible for subsequent publication.