Search Results for: utilities

post

GreenMonk TV Moderated Sustainability ScreenCast on Operational Risk Management with SAP’s Jeremiah Stone

As a new product for clients, GreenMonk are now offering moderated screencast videos – the inaugural one is with SAP’s VP of Sustainability Solutions, Jeremiah Stone. In this screencast Jeremiah and I discuss Operational Risk Management, what that has to do with sustainability, how SAP are moving from systems of record to systems of engagement, and seven minutes into the video, Jeremiah gets out his iPhone and iPad and gives a really cool demo of how their software can be used in the field.

Here’s the transcription of the screencast:

Tom Raftery: Hi everyone, welcome to GreenMonk TV. We are doing a moderated screen cast with Jeremiah Stone from SAP.

Jeremiah is VP, Sustainability Solutions. So today we are going to talking about operational risk management. Jeremiah could you first of all give me a quick intro on why you think operational risk management has anything to do with sustainability?

Jeremiah Stone: Hi Tom good morning. Thank you for having me on GreenMonk. I am a big follower and I like what you guys do. So it’s really a lot of fun for me to come on with you.

When SAP has worked with our customers, and we have a customer base in manufacturing of close to 30,000 customers, the common thing that comes back to us is that companies are engaged and interested in running more sustainably and that means using less energy, it means producing less emissions. It means recruiting people for the long term and making sure that they can adapt to changing labor conditions and changing demographics.

But there are sorta some prerequisites before people or companies can be successful with that and one of those is to cut operational losses and also to be able to adapt and change within their operations because often these factories, these plants, these operations are sort of steady state designed entities where they are very static and they are not really amenable to change.

Tom Raftery: What kind of operational losses you are referring to Jeremiah?

Jeremiah Stone: Well Tom it’s easy to think about the types of catastrophic accidents that happen throughout the world I think the Gulf oil spill is something that people think off, Bhopal thirty plus years on is still high in people’s minds. So those sorts of process safety incidents, we regrettably had a fire here in the California Bay Area not two weeks ago up at the Richmond Refinery.

These things happens, sort of, every day and what we are seeing is that as manufacturing operations and manufacturing I think of oil and gas, I think of utilities, I think of mining, but even transportation logistics air planes that sort of thing. We’ve built these systems that are very complex and sophisticated but they are not very change friendly.

So, to change them, they need to change, they need a radical change for sustainability purposes they need to have systems in place whereby you can change and continuously improve the static designed system whether it’s an energy refinery or a transportation network without having accidents, without hurting people, without creating environmental spills, et cetera. And we find that our customers are fundamentally lacking that ability.

Tom Raftery: Okay, tell me something so about or — tell me about this operational risk management solution that SAP have.

Jeremiah Stone: Okay, well maybe first we can start with what we just talked about and saying that what our customers are asking us for.

Our customers are asking us to help them innovate their operations and become more sustainable and really what that has boiled down to when you dig into it with customers is that they typically have environment health and safety management programs.

However, they really run at an individual operational entity level and so it is difficult to compare different factories, it’s difficult to compare different operations, and it’s very difficult to get proactive and move beyond very reactive, “oh no an incident happened how do we deal with that?” setting. But rather identifying risk before it turns into an incident and dealing with it.

You cannot remove risk from these operations but you can manage them. And that’s really what our customers are asking us for. And when we — we’ve gone out and we’ve worked with I think close to 50 co-innovation customers now and working with means going with our teams into their operations interviewing people throughout the company and determining what the problems are and where software can help.

What we found consistently is that it’s an information flow problem. It’s an information flow from the corporate level where the purse strings are, the ability to spend money down to the individual level and some of the problems we find is that there is a really strong and meaningful commitment to safety at the corporate level in the boardroom, however it’s very difficult to understand where to spend the money, because you have this very large sophisticated operations and it’s difficult to know where to make the investment and getting beyond a better laminated sign on the chain link fence outside the operation is tough.

And then when you get to the operational level oh gosh, every — these days margins are razor thin, the current economic situation most of your line level management or leaders are really focused on hitting outcomes, hitting on, hitting their targets. And they may be in a position to make bad decisions, here we say can we put in a bigger pump to increase production, well if you put in a bigger pump how do you know that in your, in your facility that’s not going to burst a seal somewhere?

That’s really standard process safety management, but doing that in a consistent repeatable way successfully is rather difficult and then at the individual worker level understanding the operational environment in knowing how to behave, take the right processes, be safe is a challenge, but we are completely missing the inbound engagement conduit if you will, when they see something wrong how can one, an individual worker if they see something wrong report that.

All to often, when there is a problem and we do an investigation after an incident, well gosh the workers who are in that environment knew that there was something wrong, they didn’t have a means to communicate.

Tom Raftery: Okay, so how do you fix that?

Jeremiah Stone: Well there is a lot of discussion these days in the enterprise software community moving from systems of record to systems of engagement and this is something we focused quite a bit on and I like to show you a couple of applications right now where we are taking what would be a typical approach to a system of record to identifying a risk, which would be sort of one of SAP’s typical enterprise applications at a specialist enterprise health and — environment health and safety management professional level and moving that both directions.

And so if we look at this you could imagine that you are going to have your EHS professionals that are site level managers but they are the only ones that really have that information today and they don’t have a means by which they can push that information up to corporate nor do they have a means where they can gather at large scale that information from the workers.

And what I’d like to do is that I’d like to show you how we are addressing that today in terms of a mobile application. So I am going to share with you now my iPhone. Hopefully this, comes through, can you see my iPhone?

Tom Raftery: Yep.

Jeremiah Stone: Okay, so what I’d like to do is I’d like to show you our safety issue application. Our safety issue application, let me back out of here, this is the entire application and so we are trying to really take a note out of consumer design and have one screen application without lots of tabs and drill through menus. And we have designed this application around the, “if you see something, say something” design principle and actually John Astill one of the mentors has worked on this app, that’s part of his sustainability activities.

And I’ve got a example here, I raided my son’s toy chest this morning, and just to give you an example here. You can imagine here is our little repairman out in the setting. And he notices there is something wrong with this hauler. Rather than walking all the way back to the shop, he can simply take a picture of what’s wrong with the hauler. He can say okay, I am going to use that photo, he can press the record button here and record description of what’s wrong, I am not going hit that record button because then you loose the screencast. Maybe enter quick description here, “Axle wearing too quickly on hauler,” accept that description and then simply submit the safety issue.

And so you can see there that in a few seconds we have gone from seeing something wrong, recording a description with audio and then and then sending that off to the safety experts and this is uploading like it would to YouTube or anything else. And what you haven’t seen me do is enter my name, or enter where I was, or any of those such things because we are using location based services, we are using the enterprise backbone to say who saw the thing that was wrong, where are they, et cetera.

And because we also have the entire asset infrastructure in the background, we can similarly then say, oh well actually we know which truck that was, because we have near field communications et cetera. So that’s how you get more information into the system.

Tom Raftery: But nobody ever reads these reports, do they?

Jeremiah Stone: That’s an interesting point. Now imagine you are in this world where you drop the hey I saw something wrong into the box on the wall or you submit that paper issue, how do you know what happened if you were the person that reported that. I am glad you asked that because as you can see here we have the ability to capture the safety issue, but we also have this button here that says my issues.

So if I click into that my issues what’s it’s going to do is it’s going to look for every issue that I have submitted. And I can drill in, and I can see the real time status on that issue and if it’s being worked on or not. So now I am creating mutual accountability with the safety organization, you say nobody every reads that, well guess what, you would actually know if anybody had ever, ever read it, because we are tied into the core SAP system in the background.

And now there has been a workflow sent to the responsible safety mentor and we are are using that enterprise backbone now to facilitate communication.

So, now, rather than dropping that paper form off or submitting a form, it just goes into somebody’s inbox, now we are using much, much the same in any kind of social media. We are using mobility and social media now to push that information to the responsible safety person and along with a GPS of where we are, okay it’s not picking up, but well I think I must be in my Faraday shielded office here. But, this would then be picking up my my GPS, it would also be passing out through to the application. So now the safety manager and the employee have a relationship driven by the application.

Tom Raftery: But now the safety manager has gone from receiving one notification every three months to receiving 300 everyday.

Jeremiah Stone: That’s correct.

Tom Raftery: How does he work with that or she?

Jeremiah Stone: Well I’m not going to drill into that right now, but that’s the thing we’ve always been really good at, at SAP is how to deal with the large volumes of data. And so we have the ability to sort, slice and dice this information coming in, we have heavy duty analytics to show trending, to hot spot on the basis of the information put in. We also have as you see here this little flag, immediate action required, yes or no to help to raise it or lower the priority.

And our safety manager tells us hey that’s okay, my problem in the past was really a lack of data, not too much data and I want more data. There is a well known, in the industr,y sort of a ratio between near misses to incidents, its about 300 to 1, about 300 observations or near misses to an individual incident. And if you actually go into the day to day — any of these companies and they say, oh you know, we had 100 reportable incidents but we had 6,000 reported near misses.

Well they are usually quarter, a couple of orders of magnitude off between an observation or near miss and an actual incident. And so these professionals actually want more data not less.

Tom Raftery: Cool.

Jeremiah Stone: And we give them the tools to deal with that data, but now I’m going to show you how we expose that data to people who aren’t used to dealing with that data and that’s that upper level of management that I talked about before.

So that upper level of management, who is not giving any data at all, if we were to throw 300 observations at them per day, they wouldn’t have any idea what to do with it. But if we take those people who are good at dealing with the area and we expose the output of their analysis to upper management in a mobile device as you see here in a way that they can consume it, we can get better investments.

So what you’re seeing now is incident root causes and so somebody would have entered a safety observation with the iPhone app on the left and then there is a safety professional in between who has processed that, done an investigation, identified root causes.

Now we have the ability, let’s say your upper management are rather visual learners, I can drill in here to a word cloud and rather than looking at this with boxes and rows et cetera, we can expose the root causes to management or other users, let’s say you’ve got people coming into the organization now that are not used to looking at spreadsheets their whole life but they are used looking at Tag clouds or something that you get online and we can give them their information in a way they can consume it.

And so here we can see okay we’ve got a training problem, but let’s just say for the sake of argument that we’ve got a non-millennial here looking for the root causes and they want to look at a pie graph and then they want to say okay well I understand the root cause, but I understand what injuries have been happening.

So I’m going to add another dimension here, so now I’ve taken my route causes along the bottom here; defective equipment, lack of training, we still see that spike on lack of training that we saw before but now we’ve added that body part that’s been injured and now I’m just going to sort by occurrences.

So now we can see we’ve got a — main root cause is lack of training and we have arm injuries. And so the probability here is that we’ve got new equipment, we can dig a little bit further, we probably have new equipment in the setting and people are getting hurt by that.

We talk about environmental spills, we talk about explosions but big problem with sustainability is it’s also how you’re treating your labor force and the long-term consequences of what we maybe perceiving as smaller incidents, but let me tell you if you lose a finger, you lose an arm that’s a catastrophic incident to you as a worker.

So, we want to be able to help with that as well, and also from an employer point of view, your long-term liabilities with regard to workers compensation, et cetera, and what’s great about this app is we know that managers work in primary in email, well I can now send this to let’s say my safety manager, update training and go ahead and send that off and I can go ahead and you know I’m really amazed I should have you in there.

Well and anyway I can send that off to you Raftery at Greenmonk or whatever and then what this would give you is all of the data but also that graphic and say okay let’s look at this data I’m looking at, let’s work on this together.

So we’re really trying to move from what would have been a system of record approach to safety and risk, to a system of engagement approach by pushing out the ability to identify risks, here we can see we can take a picture there, the ability to identify risks in the operational setting and also the ability to understand what those risks are and take action at the management level.

Tom Raftery: And what kinds of industries would typically be interested in solutions like this?

Jeremiah Stone: So that the types of industries we tend to work with in solutions like this tend to be what we refer to as asset intensity industries, so these are industries that have lots of trucks, planes and also large equipment and they are high risk. So you typically think of oil and gas, both upstream on the exploration and production side and downstream on the refining side.

Also think of any type of large construction, so we’re staying in the energy field here, you could do a thing of utilities, what some people refer to as large construction companies with generation capacity. And anybody who is going to be putting up say a windmill farm or solar, et cetera, it’s going to be a same challenge here in terms of people in it and with lots of stuffs moving in, lots of heavy machinery, mining, mill, production.

I mentioned utilities, that also would include utilities like phone, et cetera and then transportation logistics, think of your airlines, US, FedEx, US Post that sort of thing. There is definitely a large demand in those types of industries for this, because they are large far flung organizations where training is a big deal, they are very fast moving and risk is also a big deal and so you see the potential to have major issues there.

Tom Raftery: And what about the current economic climate, is that impacting on sales?

Jeremiah Stone: I’d say it’s driving sales even more quickly. We’re seeing in this portfolio about a 35% compound annual growth rate over the last three years since the crisis onward, and that’s because companies are becoming even more loss averse in the current environment.

So it works both ways, when you’re trying to grow and you are investing you don’t want to have incidents because you want to be fast and agile to market, but also when you’re concerned about potential production stoppages or issues with regards to your liability, say an environmental spill or people spill or people incident, you want to control that as well, and so it’s really a cycle proof investment area in that sense, because it’s both something you need when you’re growing quickly and investing and something when you are at more of a steady state and you’re looking to control loss.

Tom Raftery: We are coming on time to wrap up now, just one last thing, where do you see things going from here?

Jeremiah Stone: Well what we’ve done today is we’ve taken our portfolio as we have it and as I mentioned we have these base capabilities in your incident management risk assessments, workers safety management, management changed and we’ve moved these into more systems of engagement at both the individual worker level and the corporate level.

Where I believe we are is we barely built the foundation for what we can do here, and the next step will be utilizing our abilities to deal with big real time data and so not just having the intelligent sensor of the human pushing data in, but imagine the internet of things pushing information into a system like this and then imagine taking predictive analytics and start to not only identify a risk when we see it from a professional point of view but now put algorithms at that.

Let’s point R at that from a particular algorithm point of view and start to identify latent and hidden risk in our operations. We can have predictive safety as well and then just have to utilize our assets as well in the cloud, so for example the recent success factors, acquisition, you’ll notice something that you don’t see on the screen here is training, qualifications, ongoing learning, informal learning via collaboration.

The true moving the system engagement, we should be utilizing Jam here from SAP to help grow communities of practice and communities of expertise around safety across companies and across even value chains and we’re starting to see that as well, so I think we’ve really barely taken the first step with what we can do here.

Tom Raftery: Well, fascinating. Jeremiah that’s been great. Thanks a million for talking to us today.

Jeremiah Stone: Thank you so much Tom. Bye, bye.

post

Logica’s Sustainability Analyst briefing

Logica's Annual Report cover

Logica held a Sustainability Analysts day in London recently and they invited me to attend.

Pictured above is the cover of Logica’s 2011 Annual Report [PDF] – their Annual Report mind, not their Sustainability Report [PDF]. And yet the title of Logica’s Annual Report is Shaping a Sustainable Future. This is a good indicator of Logica’s proactive stance on Sustainability.

The half-day briefing was a mix of Logica staff talking about the company’s Sustainability products and services, as well as a couple of customers (Carbon Disclosure Project and National Centre for Earth Observation) discussing the value they get from their relationship with Logica. While it was nice having a couple of customers presenting at the event, the fact that neither of these customers are commercial enterprises, per se, could lead one to wonder whether Sustainability is lower on the agenda of traditional enterprise.

Having said that, Logica’s Tony Rooke had a slide with a long list of commercial customers for Logica’s sustainability services. Interestingly these were typically infrastructure companies like utilities, Airwave and Network Rail.

The Logica led sessions were around what Logica is calling Smart Utilities, Sustainable Mobility and also Logica’s Engagement Carbon Calculator.

In the Smart Utilities space, Logica’s Rich Hampshire talked about Logica’s three-pronged strategy (security of supply, affordability, and decarbonising energy). Logica have a Smart as a Service offering here for utilities, and Logica have traditionally been very strong in this sector.

In the burgeoning Sustainable Mobility field, Logica’s Theo Quick talked about a 10,000 point electric car charging network that Logica are rolling out in the Netherlands with eLaad.nl. This was rolled out using the Open Charge Point protocol to allow interoperability between charge points. Logica’s EMO is a vehicle emission monitoring product which, according to Logica, saved a postal company 10% of its fuel in the first three months of use. Theo also mentioned a research project called EPTIMS being rolled out in Manchester – this is a Smartphone app to encourage use of public transport by telling people when they have reached their stop, and one called eCoMove which is an FP7 funded project to reduce the number of trucks traveling around empty (transporting air).

And, Logica’s Stuart Williams mentioned their Engagement Carbon Calculator. This is a Logica offering which is in late beta mode right now. What it does is for any project that Logica carries out, it takes the client’s emissions in a business as usual case, subtracts the actual emissions, as well as the emissions of Logica’s project involvement, to give a savings result for the project.

It was heartening at this event to see Logica’s commitment sustainability, in a time when for most companies sustainability is a fancy word for cutting energy bills.

In the days following this event, Logica announced it had agreed to be purchased by Canadian company CGI. Hopefully with the change of ownership, there won’t come any diminution in Logica’s sustainability focus.

Disclosure – Logica paid for my travel and accommodation to attend this event.

Photo Credit Tom Raftery

post

Green Button and Tendril – developers as kingmakers in the energy space now as well?

Green button

One of the greatest success stories in the energy sector in the last year is the speed with which America’s Green Button initiative has been adopted.

The project started in September 2011 with a challenge laid down by then US CTO Aneesh Chopra:

today at GridWeek, I challenged the smart grid ecosystem to deliver on the vision of Green Button and provide customers access to their energy usage information electronically. With this information at their fingertips, consumers would be enabled to make more informed decisions about their energy use and, when coupled with opportunities to take action, empowered to actively manage their energy use

His challenge was taken up by the industry with almost unseemly haste.

Green Button data standards were quickly drawn up in conjunction with America’s NIST – this is vital to ensure that Green Button data is cross comparable across utilities – and more importantly, that energy management applications written for Green Button data works across all utilities. This immediately creates a significant userbase for Green Button energy apps.

Then California?s three largest utilities ? Pacific Gas & Electric, San Diego Gas & Electric, and Southern California Edison worked to create a ?Green Button? that allows customers to download their detailed energy usage with one click. Others utilities quickly followed suit and now at time of writing, 25 utility providers are supporting Green Button, including some of the nation’s biggest, like American Electric Power, CentrePoint Energy, and PacifiCorp. This brings the number of households and businesses capable of downloading their energy use information via Green Button in the US to 30 million [PDF] as of May 2012.

Technology companies also joined the efforts, and the list of those involved is long, including most of the usual suspects (Honeywell, Itron, Oracle, Schneider-Electric, Siemens, SilverSpring Networks, and Tendril) with the surprising exceptions of SAP and Logica.

Tendril are a supplier to utilities and they have now made it possible for any of their utility customers to export Green Button formatted files. Nothing too surprising about that, I hear you say. True enough, but where it starts to get really interesting is that Tendril have created GreenButtonConnect.com, a Green Button ecosystem. On this site, consumers can upload their Green Button information to any one of a number of apps hosted there to analyse their energy consumption. Even better though, any developer can use the Tendril Connect platform to develop energy apps, get access to the energy internet and have Tendril help co-market the app!

Tendril have been one of the first to realise that the old RedMonk saw Developers are the new Kingmakers applies just as much to the energy space, as it does to enterprise IT.

To this end, Tendril have also been sponsoring Hackathons themed around energy, like the recent Cleanweb Hackathon in Boulder, Colorado and January’s Cleanweb Hackathon in New York.

In a wide-ranging discussion with Tendril’s VP of Policy, Cameron Brooks, yesterday he opined that while the Green Button files are as yet, not nearly real-time, they will go more and more that direction before long. This will go a long way to facilitating the kinds of value add energy services I posted about recently here.

Photo Credit http://www.samcatchesides.com/

post

SAP’s Sustainability announcements at Sapphire Now

SAP co-CEO Jim Hagemann Snabe at Sapphire Now 2012

SAP co-CEO Jim Hagemann Snabe at Sapphire Now 2012

Technology innovation plays a major part in creating a sustainable world tomorrow

So said SAP co-CEO Jim Hagemann Snabe at this year’s SAP Sapphire Now conference in Orlando. He then went on to predict three major trends in computing for the coming years – according to Jim, in the next five years everything will move to Cloud, everything will be in main memory and everything will be mobile.

This wasn’t just some off-the-cuff remark – these three developments are core to SAP’s product roadmap – even in the Sustainability space.

In the mobile space for example, at Sapphire Now SAP announced a new version of a mobile app for incident management. With this app, workers can now log issues from their mobile device with a photo or video, as well as an audio recording, and send it directly to an incident or safety manager for corrective action. This crowd-sourcing of safety information also has built-in tracking of the reported incident which is hugely empowering for workers who may previously have felt their voice wasn’t heard. And for the companies deploying this solution it leads to a safer work environment and a happier workforce.

This puts me in mind of an initiative IBM rolled out with the Los Angeles Unified School District (LAUSD) where they enabled students, teachers and staff to report issues like water leaks, broken aircon/heating, exposed cables and so on, by sending text messages and photos through their mobile phones. More please.

Also in the mobile sustainability space, SAP have their Electronic Medical Record app [SilverLight warning] – an app which gives doctors instant access to a patient’s electronic medical records.

In the Cloud space, SAP have made two major recent acquisitions – Successfactors and more recently Ariba at a cost of roughly $7.7bn. This is a clear indicator that while SAP maybe late to the party, it is serious about catching up.

And in the Sustainability space? Well SAP’s carbon management software, Carbon Impact OnDemand is already Cloud delivered. At SapphireNow SAP announced that they are going to rollout an on-demand service for product safety that the company is calling the SAP Product Stewardship and Safety Network. This will be a network where safety professionals can share safety information and best practices.

The irony of sustainability-related software being delivered via the Cloud, a technology which is not Green at all, is not lost on me. It does appear to be lost on SAP however – more on which in a follow-up post.

And finally in-memory computing – what is it? Well, you know how information held in RAM is much faster to access than information on disk, right? So HANA, SAP’s new in-memory database, is where the database is held in RAM for much faster data access. Also, in-memory databases can hold enormous quantities of data, and query them in milliseconds. This is a huge step forward in database technologies and according to SAP it will vastly simplify database maintenance as well because there should no longer be a need for large data warehouses.

Where do the HANA and Sustainability stories intersect? There are several examples – the first is in the area of Smart Grids and Smart meters. The volumes of information utility companies will be expected to handle after installing smart meters are orders of magnitude greater than anything they are used to. Realtime analysis of this firehose of information will allow for much better demand-side management, matching the demand curve to the supply curve, stabilising the grid and allowing for greater penetration of variable generators like wind and solar. Also, this availability of highly granular energy consumption data will facilitate the development of all kinds of new energy products and services that would have previously been impossible to offer. This is sorely needed by utilities who are in the uncomfortable position of currently (no pun) having to try to convince customers to buy less of their product.

Other use interesting cases are discussed in a great post on How Big Data Will Help Achieve Sustainability Goals by SAP’s Scott Bolick. And when you finish checking that out, head on over to Jennifer Lankheim’s post on SAP Situational Awareness for Public Sector where she discusses this new SAP Rapid Deployment Solution to help public safety and security organizations better anticipate, assess, and act on emergency situations.

We are only scratching the surface of what the implications of Big Data, Cloud, Mobility and in-memory computing are for sustainability. Expect to see far more announcements in this space in the near future.

Disclosure – SAP is a GreenMonk client and SAP paid my travel and expenses to attend Sapphire Now.

Photo Credit Tom Raftery

post

Facebook hires Google’s former Green Energy Czar Bill Weihl, and increases its commitment to renewables

Christina Page, Yahoo & Bill Weihl, Google - Green:Net 2011

Google has had an impressive record in renewable energy. They invested over $850m dollars in renewable energy projects to do with geothermal, solar and wind energy. They entered into 20 year power purchase agreements with wind farm producers guaranteeing to buy their energy at an agreed price for twenty years giving the wind farms an income stream with which to approach investors about further investment and giving Google certainty about the price of their energy for the next twenty years – a definite win-win.

Google also set up RE < C – an ambitious research project looking at ways to make renewable energy cheaper than coal (unfortunately this project was shelved recently).

And Google set up a company called Google Energy to trade energy on the wholesale market. Google Energy buys renewable energy from renewable producers and when it has an excess over Google’s requirements, it sells this energy and gets Renewable Energy Certificates for it.

All hugely innovative stuff and all instituted under the stewardship of Google’s Green Energy Czar, Bill Weihl (on the right in the photo above).

However Bill, who left Google in November, is now set to start working for Facebook this coming January.

Facebook’s commitment to renewable energy has not been particularly inspiring to-date. They drew criticism for the placement of their Prineville data center because, although it is highly energy efficient, it sources its electricity from PacificCorp, a utility which mines 9.6 million tons of coal every year! Greenpeace mounted a highly visible campaign calling on Facebook to unfriend coal using Facebook’s own platform.

The campaign appears to have been quite successful – Facebook’s latest data center announcement has been about the opening of their latest facility in Lulea, Sweden. The data center, when it opens in 2012, will source most of its energy from renewable sources and the northerly latitudes in Lulea means it will have significant free cooling at its disposal.

Then in December of this year (2011) Facebook and Greenpeace issued a joint statement [PDF] where they say:

Facebook is committed to supporting the development of clean and renewable sources of energy, and our goal is to power all of our operations with clean and renewable energy.

In the statement Facebook commits to adopting a data center siting policy which states a preference for clean and renewable energy and crucially, they also commit to

Engaging in a dialogue with our utility providers about increasing the supply of clean energy that power Facebook data centers

So, not alone will Facebook decide where their future data centers will be located, based on the availability of renewable energy, but Facebook will encourage its existing utility providers to increase the amount of renewables in their mix. This is a seriously big deal as it increases the demand for renewable energy from utilities. As more and more people and companies demand renewable energy, utilities will need to source more renewable generation to meet this demand.

And all of this is before Google’s former Green Energy Czar officially joins Facebook this coming January.

If Bill Weihl can bring the amount of innovation and enthusiasm to Facebook that he engendered in Google, we could see some fascinating energy announcements coming from Facebook in the coming year.

Photo credit Jaymi Heimbuch

post

Logica and EdP’s smart grid trial in Évora

Energy management devices

Logica brought me to the pretty Portuguese town of Évora recently to check out the InovGrid project which they have been participating in, along with EdP and other partner companies.

InovGrid is an ambitious project to roll out smart grid technologies to six million customers across Portugal. Évora’s InovCity is the first stage of the project. There are 35,000 people living in Évora, almost all of whom have been issued with smart meters by now.

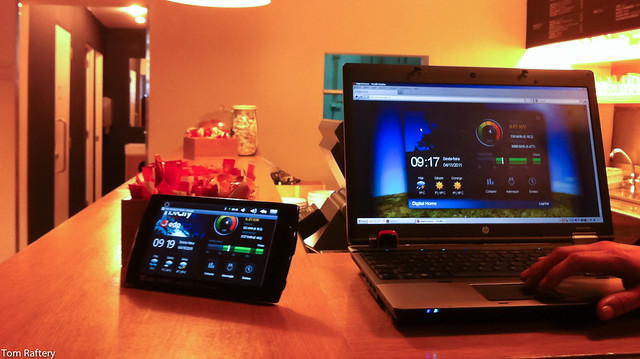
The smart meters are connected in realtime to in-home displays (like the one pictured above) which takes energy consumption readings every two seconds and plots it on the screen. It can display the usage data as kWh, CO2 or more tangibly, the € cost. If the home or business has an internet connection, this information can be viewed remotely on a computer or mobile device (as seen on the laptop on the right in the image above). Interestingly, there is two-way communication going on here, so if smart plugs are installed in the house, they can be controlled (on/off) from the in-home display, or remotely.

The information displayed on the in-home displays, and remotely, is not the same information which is sent to the utility for billing purposes. This may lead to some discrepancies in the € amount on the displays versus the amount on the bill at the end of the month. The smart meters send billing information to the utilities over Power Line Communications (with a GPRS backup). Even with the PLC connection, there is far too much data in 2 second reads, so a lower rate of reads is sent to the utility for billing purposes.

Interestingly, the in-home device shown above was installed in a coffee shop in Évora and it was possible to watch the fluctuations in the consumption graph in realtime as coffee was being made for customers. Also, the coffee shop realised €500 savings per annum in their energy bill when they examined the information from the device and realised they were not on the optimal tariff. It also demonstrated to them the savings to be had from turning off the coffee machine overnight, so the extra information from the device helped influence their behaviour.

EV Parking spot

EV Parking spot

Other than the smart meters, we were shown the information display in the town hall, which shows the realtime energy consumption of the building. This information is also supposed to be available on the town hall’s website for citizens to see remotely, though I failed to find it there (doubtless due to my lack of Portuguese!).

Other nice features on display were dedicated parking places for electric vehicles (EV’s), complete with charging stations as well as LED streetlights with motion sensors which dim the lights in the absence of people on the streets. The EV parking place was predictably empty due more to the general unavailability of EV’s than anything else. The LED streetlights though was interesting. Very few towns or cities have, as yet, embraced LED streetlights and yet 50% of a town’s energy spend can be on streetlights. LED lights can save 80-90% of the energy cost over traditional streetlights, they can report back their status (obviating the need to have staff checking for lighting failures) and they have a much longer lifetime, so they save on maintenance costs as well as energy.

It would be interesting to hear back from the InovCity people how much Évora is saving on lighting costs from the move to LED (even if only the energy savings) but even more interesting would be to try to see if the rollout of the smart meters and in-home displays has led to any sustained, per home, energy consumption reduction.

One last comment on this project – I can’t help but feel that the provision of in-home displays is an idea whose time has past. These days most people have access to a tablet, a smartphone or a computer where they can access this information. I suspect as the InovGrid project rolls out beyond the 35,000 inhabitants of Évora to rest of Portugal, the IHD’s will become at best, an added extra option, or quietly killed off.

Photo credits Tom Raftery

post

Smart meter electricity usage data and energy services

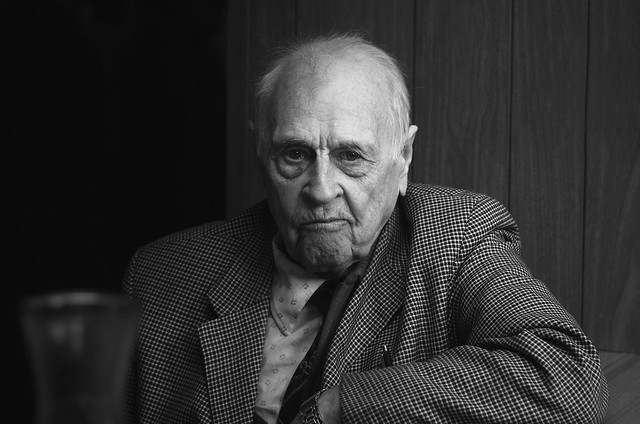
Senior citizen

Utility companies face significant challenges in the coming years, not least of which is the the need to increase revenues while helping customers reduce their consumption.

One trump card they will have is the data from their smart meter rollouts. This will enable them to offer energy services around the data which would not previously have been possible.

Simple examples of this are the ability to alert people if their consumption is about to tip them into a higher tariff band or, for people with holiday homes, a notification if the lights turn on when their property is supposed to be unoccupied.

These would be quite basic offerings – but with a little bit of thought one can imagine other higher value options.

Consider that according to the US Census Bureau:

The world?s 65-and-older population is projected to triple by midcentury, from 516 million in 2009 to 1.53 billion in 2050.

Further, there are currently 30 million solo-single households in the United States (more than the number of households containing married couples with children) and about one-third of these solo singles are men and women 65 years of age and older. The percentage is even higher in Europe.

Now, if I have an elderly relative living alone, wouldn’t it be a very useful service if I could receive a timely message from their utility company if there are deviations from the normal patterns of energy usage (if the lights aren’t turned off at 11pm or the coffee machine/kettle isn’t powered up at 8am)?

This kind of service should be quite straightforward for electricity utilities to provide once they start receiving the detailed energy usage data which smart meters will deliver. This will enable utilities to transition to becoming suppliers of energy services and open up entirely new revenue streams for them.

Photo credit gagilas

post

Logica and SAP in exclusive joint bid for UK Smart Meter data provisioning

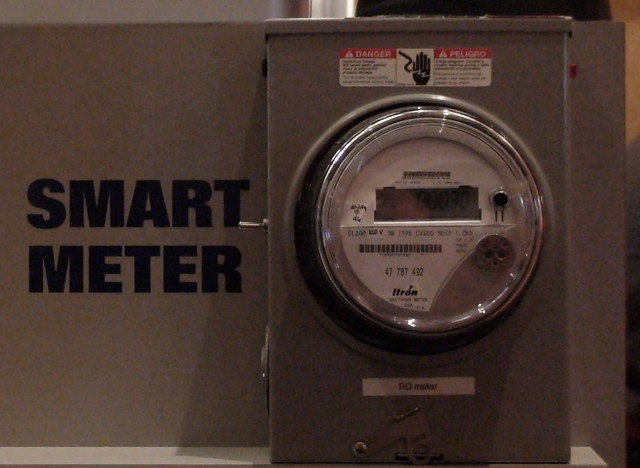
Smart meter

The UK has an interesting Smart Meter infrastructure model. Data from all the country’s Smart Meters will flow to a centralised data repository (called the DCC), from where, energy retailers will pull the data for billing purposes. The beauty of this system is that consumers dictate who has access to their data, and so switching energy providers, is not held up by data ownership issues.

The build-out of this system is still at very early stages with RFP’s expected towards the end of the year but SAP and Logica have come out of the blocks early with an announcement that they are going to put in a joint bid to become the data service provider for the DCC.

Logica and SAP are both heavily involved in the utilities sector in the UK, so it makes sense for them to bid for this – the interesting aspect is that they agreed to bid together and that their joint bid is exclusive.

The six main suppliers in the UK are all either involved in trials, or in the process of starting to trial smart meters. All six are using Logica’s head-end system for their trials, so if Logica and SAP win the bid, the transition to the DCC system should be relatively painless.

Talking to Tara McGeehan, Logica’s Head of Utilities UK on Monday, she said that the idea behind the bid was to move the debate away from technology and comms, onto the power of the data to affect things like micro-generation, energy efficiency and smart grids.

Having seen Centrica’s Smart Meter Analytics application, which runs on SAP’s HANA, earlier this year, the proposition that there is gold in them thar data, certainly rings true.

Photo credit Tom Raftery

post

Deeply embedding social media and gamification into utility companies

I was asked by the MediaLab Prado to give an updated version of my Energy 2.0 talk at their Visualizar11 – Understanding Infrastructures event in Madrid during the week.

I took the opportunity to update the deck with some of the thoughts I presented at the International SAP for Utilities event around deeply embedding social media into utility companies.

At the Visualizar11 event I talked about how utility companies will need to use gamification and competitions to pique customers’ interest in energy savings and to keep their engagement levels high. Even more importantly, done well, this will greatly extend the Mean Time to Kitchen Drawer (MTKD – the time it takes for people to get bored with an app and metaphorically stuff it in the kitchen drawer).

I was delighted then yesterday when IBM tipped me off that they are collaborating with three US utilities (CenterPoint, Oncor and San Diego Gas & Electric (SDG&E)) to launch the Biggest Energy Saver contest to help people better understand smart meter data.

In fact, there are two Biggest Energy Saver contests – one for customers to encourage them to reduce their energy consumption with a grand prize of an electric vehicle or a first-prize of a suite of GE smart home appliances in the Oncor and CenterPoint Energy service territories.

The second competition is for software developers to develop apps to help customers understand and use the information from their smart meters – this competition has potential prizes totalling up to $150,000. Serious money!

All of the details of the competitions have yet to be announced – but to really knock it out of the park, the customer competition should have social media and gamification throughout – using FourSquare-like principles of awarding badges for people who attain certain target reductions, having leaderboards, the ability to share your exploits on your social network(s) of choice, etc.

I’m giving the closing plenary keynote at the SAP for Utilities event in San Antonio this coming September where I’ll be going into these topics in a lot more detail so expect more on this here in the coming months.

post

Centrica’s Smart Meter Analytics application could make energy management compelling

As I have mentioned here previously, Smart Meters are going to bring a flood of data to utility companies which will need to be properly managed and which can be a source of intelligence for the utility, if they mine it well.

At the recent SAP Sapphire Now conference, UK Energy retailer Centrica showcased their Smart Meter Analytics application running on SAP’s HANA. HANA is SAP’s in-memory computing solution (In-memory computing moves data off traditional storage on servers and into RAM, providing a performance boost over having to read the data off disks).

Centrica are the largest single instance utility on an SAP system with 18 million residential accounts for and one million business accounts. Right now they are billing residential accounts every three months and they are managing 75 million meter reads per annum.

With the move to smart meters, Centrica will take electricity reads every 30 minutes and gas reads once per day. This means a shift from 75 million meter reads per annum to 120 billion meter reads a year. 120 billion – that’s billion with a b. That’s a phenomenal amount of data to have to deal with. Doing any kind of traditional analytics on a data set that large would very quickly get totally bogged down. One of the interesting things about HANA however is that the performance scales linearly with the hardware. If it’s starting to slow a bit with 120 billion meter reads, throw a couple of extra terabytes of ram and servers at it and hey presto you are back in business, or so the theory goes!

In the demo above, Centrica are using the analytics to examine their customer segmentation. They can look at the energy profile of similar businesses in a specific area and where there are anomalies, they can work with those businesses to help them cut their energy consumption until it is more in line with their peers. Increasing pressures to be energy-efficient and to reduce carbon footprints are being looked on by Centrica as an opportunity to open an energy services business, going to customers to help them to become more energy-efficient. The Smart Meter Analytics application is going to be crucial for this new practice within Centrica.

Centrica's Energy Efficiency Scorecard

Centrica's Energy Efficiency Scorecard

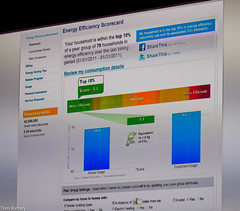
In the residential market the Smart Meter Analytics app presents householders with an Energy Efficiency Scorecard. This facilitates charting actual usage patterns against the various tariffs Centrica offers to find the optimal rate plan. The score card also allows home-owners to compare their energy efficiency with similar households in the same area.

This is an impressive use of Smart Meter analytics and it presents hugely useful information but to avoid a short MTKD (Mean Time To Kitchen Drawer – the time it takes for people to get bored with this app and metaphorically stuff it in the kitchen drawer), the scorecard has to keep homeowners engaged. There are several ways of doing this. One of main ones would be to bring in some gamification – make a game of it. The Scorecard could set energy reduction targets for people to meet in the next set period, allot points or awards for achieving reduction targets, build social media in for sharing achievements and put up a leaderboard to add some real competition to the game.

Energy management applications to-date have suffered from the fact that they were working with estimated data a lot of the time, from lack of a significant networked dataset and from a lack of a usable analytics engine. Large energy retailers, like Centrica, have the opportunity now to change that and to make energy management in the home compelling. Let’s hope they make it so.

Disclosure – SAP paid my travel and expenses to attend Sapphire Now.