post

GreenMonk TV talks flywheel UPS’s with Active Power

I attended the 2011 DataCenterDynamics Converged conference in London recently and at it I chatted to a number of people in the data center industry about where the industry is going.

One of these was Active Power‘s Graham Evans. Active Power make flywheel UPS’s so we talked about the technology behind these and how they are now becoming a more mainstream option for data centers.

Tom Raftery: Hi everyone, welcome to GreenMonk TV, we are at the DCD Converge Conference in London and with me I have Graham Evans from Active Power. Graham you guys, you make the spinning UPSs.

Graham Evans: That?s right yes the flywheel UPSs, kinetic energy. So behind us here we have our powerhouse. So what we found with the flywheel UPS is because of its high density environment, the fact it doesn?t need cooling the fact that it is really suited to a containerized environment we?ve put it in a powerhouse to show the guys in DCD to show the benefits that we can provide from a systems perspective.

Tom Raftery: So what the flywheel UPS does is it takes in electricity, while the electricity is running, spins wheels really, really fast and then if there is a break it uses that kinetic energy to keep the system up.

Graham Evans: Not quite, so the flywheel itself is spinning all the time as an energy storage device. The UPS system is primarily conditioning the power. So as the power comes through it?s a parallel online system, all of the kilowatts flow through to the load and our converters regulate that power to make sure you get UPS grade output through to your critical load. At the same time the flywheel is spinning it?s sat there as a kinetic energy store ready to bridge the gap when its required to do so.

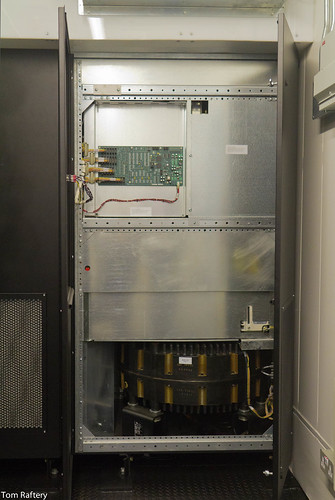
Active Power flywheel UPS

An Active Power flywheel UPS

So voltage or mains fails on the input, the flywheel itself changes state instantaneously from a motor to a generator and we extrapolate that kinetic energy through some converters to support the load, start our diesel engine, and that then becomes the primary power source through to the system.

Tom Raftery: And you got the diesel engine in fact built into the system here, it?s on the right hand side as we are looking at here. So there is a reason that you have your own diesel engine kind of fitted into in there.

Graham Evans: Yes, so we are not holding into one particular diesel engine manufacturer so what we do as a complete system is designed as a critical power solution. So the thought really is from a client point of view we can be flexible in terms of their requirements. We can size the engine to support the UPS load only or maybe we can pick up some mechanical loads as well. We make some enhancements to the diesel so we have our own diesel controller to start the diesel quickly. We have our own product we call GenSTART,which allows us to have a UPS backed starter mechanism to the system so we can use that UPS power to start it.

Tom Raftery: And that?s important because the flywheel don?t stay up as long as say a battery bank.

Graham Evans: Its important because this type of loads that we are supporting need that quick power restorations, so from a UPS point of view we need to restore or keep power instantaneously that?s the job of a UPS, no break power supply, but we also find with mechanical loads certainly in high density datacenter environments we need to restore the short break mechanical loads very quickly. So the system you see here is able to do that. We continuously support the UPS load and we can bring on the cooling load ten seconds afterwards. So very fast starting, very robust system.

Tom Raftery: And the whole flywheel UPS idea is relatively new comer to the datacenter environment?

Graham Evans: Not especially I think it feels like that sometimes but we have been around for 15 years as a business, we have 3000 plus installations worldwide, but certainly we are not as common place as some other technologies but we are probably one of the fastest growing companies globally. So, yeah not brand new 15 years in business, but yeah the concept?s really taken off and it?s been really successful for us.

Tom Raftery: Cool. Graham that?s been fantastic, thanks for coming to the show.

Graham Evans: No problem, thank you, cheers.

post

IBM launch Intelligent Water for Smarter Cities

Water

Intelligent water is the latest addition to the IBM Smarter Cities portfolio.

in the world’s cities are growing at an astounding rate. For the 1st time in history, over 50% of the world’s population now lives in urban areas. Over 1 million people are moving into cities every week, and it is estimated that by 2050 70% of people on the planet will live in cities.

This unprecedented growth in urban populations makes the provision of basic services like transport, security, water etc. increasingly complex. This is irrespective of whether the city is a mature city or a developing one. It was against this backdrop that IBM launched its Smarter Cities product.

At the core of this offering is its Intelligent Operation Center (IOC) which takes inputs from systems throughout the city and depending on the input, raises alerts, kicks off workflows, or displays the information on any of a number of dashboards which can be configured to display differing information based on a user’s login.

The newly announced Intelligent Water offering is yet another module capable of working with the IOC. In their briefing call, IBM were at pains to point out that their experience working with custom projects like the ones in Galway Bay, the Washington DC, and the Dubuque, Iowa all helped shape this new product.

Water issues are global in their reach, even if the difficulties differ from region to region (i.e. drought in Texas, flooding in Thailand, water quality in India).

IBM’s Intelligent Water helps organise water-related work. It drives proactive maintenance and schedules the maintenance so that the majority of the time is spent actually doing the maintenance, as opposed to driving between destinations. It allows water managers to see where the water is going – is it being delivered to customers, or disappearing through leaks in the pipework? Are customers using it effectively or not?

It integrates with geospatial packages and has map-based views, there are analytics for optimized scheduling, work order reporting, water usage reporting and display dashboards with roles-based information display. It is possible therefore to create views for the public (to display on the municipality’s website, for example), views for the Mayor’s office and others screens for the water planners and water operators.

According to IBM, Intelligent Water is available today. It comes with IBM’s business intelligence reporting tools as part of the solution and is available in standalone, cloud or hybrid versions.

I’m open to correction, but I’m not aware of any other company offering a comprehensive city management software solution like this. With cities growing at the rates they are, and most resources being finite, management solutions like this are going to be in greater and greater demand.

Photo credit Tom Raftery

post

GreenMonk TV talks data center standardisation with Schneider Electric

I attended the 2011 DataCenterDynamics Converged conference in London recently and at it I chatted to a number of people in the data center industry about where the industry is going.

The first of these was Paul-François Cattier of Schneider Electric who talked about the need for standardisation of infrastructure in the data centers to speed up the time to build.

Tom Raftery: Hi everyone, welcome to GreenMonk TV. We’re at DCD London Converge and with me I have Paul-François Cattier, who is VP Data Center Solutions for Schneider Electric. Paul welcome to the show.

Paul-François Cattier: Thank you Tom.

Tom Raftery: So Paul you guys made a bit of an announcement at the show here, can you talk to us a little bit about that?

Paul-François Cattier: Yes we announced what we call the way to bring the standardization and modular IT into data centre to bring energy efficiency in the data centre. So basically what we think is today’s data centre industry is still very immature in its infancy and we need to bring this with stage of maturity to be better efficient.

Tom Raftery: So tell me why do you think a modular infrastructure is better for data centres?

Paul-François Cattier: It’s not really the modular infrastructure that is better for energy efficiency in data centre, it is really the standardization that allow this modular IT. In fact what we need to bring into the data centre, I think to bring it to maturity is the standardization and to be able to standardize the data centre, you need to find a point of granularity of modularity, where you bring the standardization and after a lot of these different data centers have been serving the different business peoples but this level of standardization will allow a lot of CapEx and OpEx efficiency in your data centre and you know that most of the OpEx of the data centre are in the energy.

Tom Raftery: So talk to me about standardization. What exactly are you talking about when you say standardization, standardization of?

Paul-François Cattier: Most of the data centre today are designed as unique design. So each time it’s very long process to design data centre because it’s a unique design so you have 24 months, 20 months before you decide to do a data centre when you are coming to the completion of the data centre. So with the standardization you are using subsystems that are completely standardized, manufacture build, manufacture interested, respectable performance and you are using these bricks or these blocks or these Lego if you want of subsystems, standardized subsystems to build your data centre.

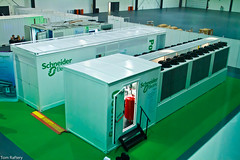
Schneider Electric Power and Cooling modules

If doing this, you can really build your data centre in three to four months with optimized performance and ensure due to this standardization that the management that is needed to really tie the data centre physical infrastructure and its energy consumption to the effective IT of your data centre to be enabled in the data centre because as the data centre is very much in standardized module, it’s very easy to require this type of management system. So like if you want — if you would like to develop yourself, your GPS in your car, it will — you will spend maybe 20 years before being able to use your own GPS designed by you.

What you do is you share the R&D to have an excellent GPS system that is sold to many, many customer to spread out the cost. So this is what standardization and modularity will bring into the data centre world.

Tom Raftery: How far away do you reckon we are from that becoming the norm? I mean you talk about the data centre industry currently being quite immature. When do you reckon we will be that much further along that this will be the norm?

Paul-François Cattier: Well we have a long way to go. Today 80% of the new built data centre are still built in a very traditional way, that is totally inefficient in terms of CapEx use, in terms of OpEx use and in terms of energy efficiency, and you know that we are working in all the market, we are in Schneider Electric to bring energy efficiency into this market. And really we believe that the standardization in the modularity enables the management aspect of the challenge to be enabled, and — enabled to be enabled of course and allow this energy efficiency and when you save 1 kilowatt at the plug, you save most of the time 3 kilowatt as a generation plant.

Tom Raftery:
Great. Well François that?s been fantastic, thanks for coming on the show.

Paul-François Cattier: Thank you very much Tom.

post

Power Usage Efficiency (PUE) is a poor data center metric

Problems with PUE

Power Usage Effectiveness (PUE) is a widely used metric which is supposed to measure how efficient data centers are. It is the unit of data center efficiency regularly quoted by all the industry players (Facebook, Google, Microsoft, etc.).
However, despite it’s widespread usage, it is a very poor measure of data center energy efficiency or of a data center’s Green credentials.

Consider the example above (which I first saw espoused here) – in the first row, a typical data center has a total draw of 2MW of electricity for the entire facility. Of which 1MW goes to the IT equipment (servers, storage and networking equipment). This results in a PUE of 2.0.

If the data center owner then goes on an efficiency drive and reduces the IT equipment energy draw by 0.25MW (by turning off old servers, virtualising, etc.), then the total draw drops to 1.75MW (ignoring any reduced requirement for cooling from the lower IT draw). This causes the PUE to increase to 2.33.

When lower PUE’s are considered better (1.0 is the theoretical max), this is a ludicrous situation.

Then, consider that not alone is PUE a poor indicator of an data center’s energy efficiency, it is also a terrible indicator of how Green a data center is as Romonet’s Liam Newcombe points out.

Problems with PUE

Consider the example above – in the first row, a typical data center with a PUE of 1.5 uses an average energy supplier with a carbon intensity of 0.5kg CO2/kWh resulting in carbon emissions of 0.75kg CO2/kWh for the IT equipment.

Now look at the situation with a data center with a low PUE of 1.2 but sourcing energy from a supplier who burns a lot of coal, for example. Their carbon intensity of supply is 0.8kg CO2/kWh resulting in an IT equipment carbon intensity of 0.96kg CO2/kWh.

On the other hand look at the situation with a data center with a poor PUE of 3.0. If their energy supplier uses a lot of renewables (and/or nuclear) in their generation mix they could easily have a carbon intensity of 0.2kg CO2/kWh or lower. With 0.2 the IT equipment’s carbon emissions are 0.6kg CO2/kWh.

So, the data center with the lowest PUE by a long shot has the highest carbon footprint. While the data center with the ridiculously high PUE of 3.0 has by far the lowest carbon footprint. And that takes no consideration of the water footprint of the data center (nuclear power has an enormous water footprint) or its energy supplier.

The Green Grid is doing its best to address these deficiencies coming up with other useful metrics such as, Carbon Usage Effectiveness (CUE) and Water Usage Effectiveness (WUE).

Now, how to make these the standard measures for all data centers?

The images above are from the slides I used in the recent talk I gave on Cloud Computing’s Green Potential at a Green IT conference in Athens.

post

Data Center War Stories talks to the Green Grid EMEA Tech Chair Harqs (aka Harkeeret Singh)

And we’re back this week with another instalment in our Data Center War Stories series (sponsored by Sentilla).

In this episode I talked to the Green Grid’s EMEA Tech Chair, Harqs (also known as Harkeeret Singh).

The Green Grid recently published a study on the RoI of energy efficiency upgrades for data center cooling systems [PDF warning]. I asked Harqs to come on the show to discuss the practical implications of this study for data center practitioners.

Here’s the transcript of our conversation:

Tom Raftery: Hi everyone, welcome to GreenMonk TV, this is the Data Centers War Stories series sponsored by Sentilla. The guest on the show today is Harkeeret Singh aka Harqs. And Harqs is the EMEA Tech Chair of Green Grid. Harqs welcome to the show.

Harqs: Thank you Tom.

Tom Raftery: So Harqs as the Tech Chair of the Green Grid in the EMEA region, you get a larger overview of what goes on in data centers than some of the previous interviewees we?ve had on the show.

We have been talking about kind of the war stories, the issues that data centers have come across and ways they have resolved them. I imagine you would have some interesting stories to tell about what can go on in data centers globally. Do you want to talk a bit about some of that stuff?

Harqs: The Green Grid undertook a study which implements a lot of good practices that we all talk about in terms of improving air flow management and increasing temperature, putting in variable frequency drives. And what we did is after each initiative, we measure the benefit of — in terms of — from an energy consumption perspective.

And Kerry Hazelrigg from the Walt Disney Company led the study in a data center in the southeast of the US. And we believe that is representative of the most data centers, probably pre-2007, so we think there is a lot of good knowledge in here which others can learn from.

So I am going to take you through some of the changes that were made and some of the expectations but also some of the findings some of which we weren?t expecting. So starting with — there was five different initiatives, the first initiative was implementing the variable speed drives. And what we found was, they installed new CRAC units and CRAH units which they put in variable frequency drives in the standard, there is 14 of them, and then they retrofitted 24 existing CRAHs. And took out the fixed speed drives and put in the variable speed drives.

The expectation was we would find a reduction in energy consumption and fan horsepower. And also there was a potential of maybe looking always the providing of coolant to the right place in the data center. And once we put those in, we found out that they didn?t actually introduce any, any hotspots, which was a positive thing. But some of the things that were a little different from what we expected and the PUE didn?t reflect the savings. That was because there was external factors, things like the external weather which impacted the PUE figure as well. So you need to bear that in mind as you make changes. You need to look at the average across the year.

The other issue that we found was by putting in variable speed drives they found it introduced harmonics to the power systems. And that came through the monitoring tools and so they are putting — they put in filtering to help resolve those harmonics.

The last issue was also around skills, so they had to train the data center staff on using variable frequency drives and actually maintain them. This was the biggest power saving, it was a third of the overall saving and the saving in total was 9.1% of energy consumption and that?s saved some thing in the order of $300,000 in terms of real cash and the PUE went down from 1.87 down to 1.64 by doing these five initiatives.

The second issue was actually putting in the air flow management. So things like the blanking panels and the floor grommets, putting in the cold tiles where they are supposed to be, and that was for around 7 inch cabinets and the findings were that that reduced the cold aisle temperature because you have less mixing, and also increase the temperate on the hot isle in terms of the temperatures going back to the CRAH. So that was interesting.

We saw that being a key enabler to actually increase in temperature, so you have cold to cold aisles and hot to hot aisles because of those mixing. There wasn?t any energy savings for this piece in itself, but it was in this — airflow management activity is an enabler in that it allows you to then do some optimization and also to increase temperature without risk.

The third activity was relocating the sensors that the CRAHs worked off from, way from the return to CRAC and return to CRAH which is what most data centers use today to actually aligning that to sensors on the front of the cabinets. So actually moving from return air to supply and that?s the specification that ASHRAE provides, that?s what we should be controlling, the temperature and the humidity of the air going into the servers. They themselves say they don?t really care about what the temperature is coming out of back of the servers. Well the rest of us do from a — making sure that it?s not too hot for our data center operators.

So what we did was move those sensors to the front of cabinets and what that did was that optimized the fan speeds and actually started to raise the temperature and the cold air that was required by the servers. It did take them a little awhile getting the locations right, so making sure that they have them moving them around as much as possible, looking the CFD to make sure they are optimizing and putting it in the right place eventually. And that was a small improvement, but it was the — again another enabler for increasing temperate. So there was only a few percent improvement by doing that, but what it does is when you start look at increasing temperature you are increasing temperature at the right point.

Tom Raftery: So how much did it increase temperature by — was it like from 20 to 25 or… —

Harqs: That?s a good question as the next initiative they did was, they were increasing the temperature, so I was just about to — so they went from 18? C, which was what their original set point was and they took it up to 22? C. Now obviously that?s still in the middle of the ASHRAE standard. So there is still more scope there to become better. But it wasn?t just increasing the temperature in the room but it was actually increasing the temperature of the chiller plant which — where the biggest savings were, so if you increase the temperature of the room that then allows you to increase the temperature of your chiller plant.

And that?s — they increase the set point of their chiller plant from 6.7? C to just under 8. And what they found was, there was significant savings due to the reduction in compressor and condensor fan power. And what they found was for each and I’m going to do this in degree F because they calculate degree F. So they went from 44 to 46? F. For every degree F they increased the set point of the chiller, they found out that reduced just over 50 kilowatts of chiller energy consumption.

Now in terms of other people?s data centers, they are also — your mileage may vary depending on the configuration and where you are, but that?s what their significant saving was. By doing that what they found was — by doing it this way, where they put the air flow management in place and then they increased temperature in the room, increased the set points of the chiller plant they found that actually there was — that made no significant impact on the data center in terms of hot spots or anything like that. So there is no detrimental impact to the data center by doing this. Obviously the saving of the energy was a positive and saved real money.

Tom Raftery: Alright, Harqs that was great, thanks a million for coming on the show.

post

Data Center War Stories talks to CIX’s Jerry Sweeney

And we’re back this week with the third instalment in our Data Center War Stories series (sponsored by Sentilla).

In this episode of the series I am talking to Jerry Sweeney. Jerry is Managing Director of Cork Internet eXchange (CIX). CIX is a small, currently co-lo, data centre located in Cork, Ireland (and full disclosure – I was a co-founder of CIX).

I love Jerry’s story about the chiller compressors coming on for the first time after 12 weeks – free cooling rocks! (watch the video, or see the transcript below!).

Here’s the transcript of our conversation:

Tom Raftery: Hi everyone and welcome to GreenMonk?s DataCenter War Stories sponsored by Sentilla. The guest in the show is CIX?s Jerry Sweeney. Jerry is Director of Cork Internet eXchange. Jerry welcome to the show.

Jerry Sweeney: Thank you for having me Tom.

Tom Raftery:
Jerry can you tell me a little bit about Cork Internet eXchange, how old it is, what kind of size you are talking about?

Jerry Sweeney: Cork Internet eXchange was conceived in 2006, in September of 2006, construction occurred in 2007, and it opened for business in March 2008. So it?s 3-years-old now.

We have two rooms on the technical floor area, one of them is kitted out, it?s 3,000 square feet and the other one is available for expansion and that?s also 3,000 square feet, as well as there is approximately 7,000 or 8,000 square feet for the services, offices, call center and so on.

So, whatever that works out at 12 and seven, so it?s about 19,000 square feet in total. Eventually it will be a 240 rack facility. At the moment we have about 75 occupied racks. To date it?s exclusively a collocation facility, but we are now getting into the infrastructure as a service and platform as a service business.

Tom Raftery: In the building of a facility of that size what kind of — what are the most pressing kind of issues you come across typically day to day?

Jerry Sweeney: I suppose your question had the concept of size and — so we are a very small data center, and I suppose trying to scale the expenses against our revenue stream is probably an issue with a company this size. So running 24/7 shifts, so I would say scale is probably our biggest single problem, and having people with the right resources, and having the facility occupied. If you have a 1000 racks okay, then you can spread those costs over a greater number of customers and a greater number of racks.

Tom Raftery: Any interesting things that you — any interesting problems you happened to cross and solutions you came up with to solve them?

Jerry Sweeney: We live in a city Tom with 160,000, 170,000 people. We — all of the data centers in Ireland are basically clustered around Dublin, all of the connectivity that comes into Ireland is located or lands in Dublin.

So, remoteness and scale okay were huge problems for us when we started off. And one of the big issues for us okay was to get adequate connectivity into the building so that we would be taken seriously. And we came up with a strategy very early on and the strategy was to — initially before we focused on being a data center that we focused on being a regional internet connectivity center.

And the name of the business is very interesting; the name of the business is Cork Internet eXchange. We registered the URL which was the Cork Data Center, but we never used it, and the reason for that is because Cork Internet eXchange was more vital to us at start up then the Cork Data Center.

So, in order to justify gigabit connectivity in the back-haul costs around that, we had to get serious volumes of IP transit through the building first. And we have a 30 meter, it was 24 meters initially, but we just added six meters to it this year, our address is Hollyhill and that?s a clue, we are on top of a hill. That enabled us to sign up every single wireless internet service provider in the region.

So, all of the non-incumbent supply broadband homes and businesses in Cork take their connectivity out of here and we see that as being about 20,000 homes and businesses. So that was a huge win for us in the 2000 — in early 2009. By the time we got to say March 2009, which would be a year after we opened, we had our IP transit up in the gigabits and that made cost effective procurement of transit sensible.

And it was at that time that we noticed a growth in the — people took us more seriously as a data center, because of the connectivity. We had the resilience from design in, what we didn?t have is, we didn?t have connectivity at a price okay, and at a quality level that made us attractive.

So, I think that probably was the? and if we hadn?t been successful of getting that connectivity issue; then, I don?t think we would have been able to scale as a data center.

Tom Raftery: Can you talk a little bit about some of the interesting concepts that went into the design of the data center?

Jerry Sweeney: The concept of building the data center was started in September 2006, and we made a decision in 2006 to go for cold aisle containment and today that seems like a really kind of standard idea — the argument is now do you go for hot aisle or cold aisle containment. But in 2006, it was actually even alternate hot and cold aisles were considered novel at that time.

So it seemed like a remarkable unusual thing. So we built it from the ground up with the cold aisle containment as a strategy. Also because we are located in Cork, which is a mild ? neither hot or cold climate, we have 11 degrees as an ambient temperate, average for the year and the difference between summer and winter is not enormous, so we are able to take advantage of an awful lot of free cooling.

Even in the summer at night time we can usually do free cooling here and for much of the winter okay, our chillers never start. We know that our chillers did not start from the — from November of 2010 until a warm sunny afternoon in February. So free cooling okay, took us for whatever number of weeks, that is six and six — about 12 weeks, without ever starting a compressor.

We were shocked when the compressor cut in, what?s that noise, okay.

Tom Raftery: Jerry it?s been fantastic. Thanks a million for coming on the show.

Jerry Sweeney: Yeah, it?s my pleasure; Tom, thank you.

post

The whole interest in sustainability is wearing off isn’t it? SAP’s Scott Bolick answers

At the SAP TechEd event in Madrid recently, JD-OD.com had an interview scheduled with SAP’s Scott Bolick. Scott is responsible for SAP’s Sustainability Solutions. Dennis Howlett, of JD-OD, knowing my interest in sustainability, asked if I’d like to conduct the conversation with Scott.

I was happy to oblige and so here’s a transcript of our chat:

Tom Raftery: Hi everyone. This is Tom Raftery of GreenMonk TV, doing interview for JD-OD. And with me I have Scott Bolick from SAP. Scott, would you like to introduce yourself?

Scott Bolick: Thanks Tom. My name is Scott Bolick as you said, and I’m responsible for SAP Sustainability Solutions and those solutions are across at four different areas and hopefully we can chat a little bit about those now.

Tom Raftery: Sure. So Scott, sustainability it’s a – the whole interest in sustainability is wearing off isn’t it, nobody is really into sustainability these days. Am I right?

Scott Bolick: Well I think you are wrong, I think there is a caveat. I think one of the things that we’ve seen in the market which I think is actually a good sign is that sustainability was a topic de joure in 2008, 2009. It’s still there, you still see more and more CSOs coming online but what you are seeing is instead of a centralization of power within those chief sustainability officers, what you are actually seeing is the sustainability officers setting the strategy for the company.

And then whenever you look at the actual execution, when we look at where people are actually purchasing IT that really is coming down into the LOB, so it’s R&D for sustainable products. It is the supply chain when you look at sustainable supply chain. It’s manufacturing whenever you look at sustainable operations. So I think to say that it’s not there, it is wrong, I think it’s there, it’s stronger than ever. I think what people are discovering is it’s sedimenting back into the underlying businesses and that’s where it should be fundamentally.

Tom Raftery: Okay, but I mean with the current state of the economy, are people really willing to get their –stick their hand in their pocket and spend money on sustainability solutions?

Scott Bolick: Yeah, absolutely. And I think when you take a look at why people buy for sustainability, I think there is three reasons people buy. First and foremost is compliance, and there are increasing regulations around the globe whether it be for product or whether it be not just for — whether it be safety and showing that you are increasing the safety within your operations. And so one of course whenever you take a look at that and you look at the complexity of business, it’s spread out on global operations, they need solutions that are IT solutions to be able to adhere to those regulations in a timely and in a low cost manner.

Second you continue to see people interested in those solutions that help them save money, energy management obviously being top of mind.

And third, there are those companies that are spending on aspirational, really trying to understand what is the product footprint of the products that they sell into the market and how they can lower that footprint whether it’d be carbon or whether it’d be other substances.

Tom Raftery: And where are you seeing most of the traction these days? What is the most – what is the area of the largest – well either spend or interest for SAP at the moment?

Scott Bolick: I think if you take a look at some areas that are really hitting for SAP, one of the areas is operational risk management. And if you would go back and you just look at the last couple of years, what you see are these big events that these events happen and then there is a tremendous impact on the brand reputation, there is a tremendous impact on the financial valuation of those companies. And so what you are seeing is companies on a trend, the first trend on operational risk was really about compliance, am I compliant to regulations, now you are seeing people increasingly looking at proactive prevention, how do I actually go out and report incidents before they happen, how do they then analyze those incidents, put them in a risk framework and then how do I actually execute management of change. So we are definitely seeing a tremendous amount of interest from across multiple industries.

And finally what we are beginning to see is some really interesting stuff where people are looking at the tremendous amount of data they have and trying to figure out how they can correlate that data and actually get into predictive analytics around risk. So that’s one of the areas we’re definitely seeing.

Tom Raftery: Okay and when you talk about data I mean a lot of – the various solutions have massive amounts of data associated with them, how is SAP going to handle that, the big data issue?

Scott Bolick: I think one of the things that we are fortunate is that unlike some players in the market, we within SAP have strong technology both for analytics and then when you look at big data obviously we have HANA. So some of the things that we are doing is working with customers and determining how we can leverage HANA to push them over limits that they might otherwise have. Limits in terms of their own operations and limits in terms of processes.

One of the ones I love is we have an embedded product compliance customer who is now looking at putting embedded product compliance on top of HANA. So this company has 100,000 different recipes, they produce 3000 to 4000 documents a day and obviously that’s on the backend, but on the front end they have got to really make sure during the design process that they understand whether or not the substances, whether or not the ingredients are going to be compliant to regulations. One of the things they are doing is by putting it on HANA is they can get the check back in a second rather than getting a check back in terms of minutes or hours. And obviously if you are in R&D, the last thing you want to do is your designing — is to sit in front of the computer and wait to determine whether or not it’s compliant with regulations and obviously those regulations are regulations that are country specific.

Tom Raftery: Sure. So sustainability is here to stay.

Scott Bolick: Absolutely.

Tom Raftery: Great. Scott, thanks a million.

post

Data Center War Stories talks to SAP’s Jürgen Burkhardt

And we’re back this week with the second instalment in our Data Center War Stories series (sponsored by Sentilla).

This second episode in the series is with Jürgen Burkhardt, Senior Director of Data Center Operations, at SAP‘s HQ in Walldorf, Germany. I love his reference to “the purple server” (watch the video, or see the transcript below!).

Here’s a transcript of our conversation:

Tom Raftery: Hi everyone welcome to GreenMonk TV. Today we are doing a special series called the DataCenter War Stories. This series is sponsored Sentilla and with me today I have Jürgen Burkhardt. Jürgen if I remember correctly your title is Director of DataCenter Operations for SAP is that correct?

Jürgen Burkhardt: Close. Since I am 45, I am Senior Director of DataCenter Operations yes.

Tom Raftery: So Jürgen can you give us some kind of size of the scale and function of your DataCenter?

Jürgen Burkhardt: All together we have nearly 10,000 square meters raised floor. We are running 18,000 physical servers and now more than 25,000 virtual servers out of this location. The main purpose is first of all to run the production systems of SAP. The usual stuff FI, BW, CRM et cetera, they are all support systems, so if you have ABAP on to the SAP in marketplace, you, our service marketplace, this system is running here in Waldorf Rot, whatever you see from sap.com is running here to a main extent. We are running the majority of all development systems here and all training — the majority of demo and consulting system worldwide at SAP.

We have more than 20 megawatt of computing power here. I mentioned the 10,000 square meters raised floor. We have 15 — more than 15 petabyte of usable central storage, back up volume of 350 terabyte a day and more than 13,000 terabyte in our back up library.

Tom Raftery: Can you tell me what are the top issues you come across day to day in running your DataCenter, what are the big ticket items?

Jürgen Burkhardt: So one of the biggest problems we clearly have is the topic of asset management and the whole logistic process. If you have so many new servers coming in, you clearly need very, very sophisticated process, which allows you to find what we call the Purple Server, where is it, where is the special server? What kind of — what it is used for? Who owns it? How long is it already used? Do we still need it and all that kind of questions is very important for us.

And this is also very important from an infrastructure perspective, so we have so many stuff out there, if we start moving servers between locations or if we try to consolidate racks, server rooms and whatsoever, it’s absolutely required for us to know exactly where something is, who owns it, what it is used for etcetera, etcetera. And this is really one of our major challenges we have currently.

Tom Raftery: Are there any particular stories that come to mind, things issues that you’ve hit on and you’ve had to scratch your head and you’ve resolved them, that you want to talk about?

Jürgen Burkhardt: I think most people have a problem with their cooling capacity. Even if we are — we are running a very big data center. We have a long capacity down the other side. There was room for improvement. So what we did is we implemented a cool aisle containment system by ourselves.

So there are solutions available, you can purchase from various companies. So what we did is, so first of all we measured our power and cooling capacity and consumption in very detail, and on basis of that we figured out a concept to do that by ourselves.

So the first important thing is today I think it’s standard. We have to change our requisitions, especially in the DataCenter which is ten years old, and which now also got the premium certificate. That data center, the rack positions were back front, back front, back front and we had thousands of servers in that data center.

So what we are now doing, already did to some extent in that data center is, we had to change the rack positions front, front to implement the cold aisle containment system. And we did — so IT did that together with facility management. So we had a big project running to move surplus shutdown, racks, turn whole — the racks in whole rows, front to front and then built together with some external companies, it was very, very normal easy method. Buying stock in the next super market more or less, build the containment systems and that increased where we have implemented it the cooling capacity by 20%.

Tom Raftery: Is there anything else you want to mention?

Jürgen Burkhardt: Within the last three to four years we crashed against every limit you can imagine from the various type of devices which are on the — available on the market, because of our growth in size. The main driver for our virtualization strategy is the low utilization of our development and training servers. So what we are currently implementing is more or less a corporate cloud.

When a few years ago, we had some cost saving measures, our board said, you know what, we have a nice idea, we shutdown everything, which has a utilization below 5% and we said well, that might not be a good idea, because in that case we have to shutdown everything, more or less. And the reason if you imagine a server and an SAP running, system running on it and a database for development purpose, maybe a few developers are logging in, this is from a CPU utilization, you hardly see it, you understand.
So the normal consumption of the database and the system itself are creating most of the load and the little bit development of the developers is really not worth mentioning. And even if they are sometimes running some test cases, it’s not really a lot. The same is true for training, during the training sessions there is a high load on the systems.

But on the other side these systems are utilized maybe 15% or 20% maximum, because the training starts on Monday, stops at — from 9:00 to 5:00. Some trainings even go only two or three days. So there is a very low utilization. And that was the main reason for us to say, we need virtualization, we need desperately and we achieved a lot of savings with that now and currently we are already live with our corporate cloud.

And we are now migrating more and more of our virtual systems and also the physical systems which are now migrated to virtualization into the corporate cloud. With a fully automated self service system and a lot of functionality which allows us to park systems, unpark systems, create masters and also the customers by himself. This is very interesting and this really gives us savings in the area of 50% to 60%.

Tom Raftery: Okay Jürgen that’s been fantastic, thanks a million for coming on the show.

post

Logica and EdP’s smart grid trial in Évora

Energy management devices

Logica brought me to the pretty Portuguese town of Évora recently to check out the InovGrid project which they have been participating in, along with EdP and other partner companies.

InovGrid is an ambitious project to roll out smart grid technologies to six million customers across Portugal. Évora’s InovCity is the first stage of the project. There are 35,000 people living in Évora, almost all of whom have been issued with smart meters by now.

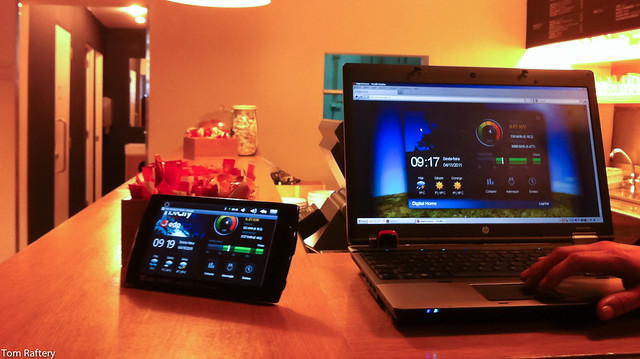
The smart meters are connected in realtime to in-home displays (like the one pictured above) which takes energy consumption readings every two seconds and plots it on the screen. It can display the usage data as kWh, CO2 or more tangibly, the € cost. If the home or business has an internet connection, this information can be viewed remotely on a computer or mobile device (as seen on the laptop on the right in the image above). Interestingly, there is two-way communication going on here, so if smart plugs are installed in the house, they can be controlled (on/off) from the in-home display, or remotely.

The information displayed on the in-home displays, and remotely, is not the same information which is sent to the utility for billing purposes. This may lead to some discrepancies in the € amount on the displays versus the amount on the bill at the end of the month. The smart meters send billing information to the utilities over Power Line Communications (with a GPRS backup). Even with the PLC connection, there is far too much data in 2 second reads, so a lower rate of reads is sent to the utility for billing purposes.

Interestingly, the in-home device shown above was installed in a coffee shop in Évora and it was possible to watch the fluctuations in the consumption graph in realtime as coffee was being made for customers. Also, the coffee shop realised €500 savings per annum in their energy bill when they examined the information from the device and realised they were not on the optimal tariff. It also demonstrated to them the savings to be had from turning off the coffee machine overnight, so the extra information from the device helped influence their behaviour.

EV Parking spot

EV Parking spot

Other than the smart meters, we were shown the information display in the town hall, which shows the realtime energy consumption of the building. This information is also supposed to be available on the town hall’s website for citizens to see remotely, though I failed to find it there (doubtless due to my lack of Portuguese!).

Other nice features on display were dedicated parking places for electric vehicles (EV’s), complete with charging stations as well as LED streetlights with motion sensors which dim the lights in the absence of people on the streets. The EV parking place was predictably empty due more to the general unavailability of EV’s than anything else. The LED streetlights though was interesting. Very few towns or cities have, as yet, embraced LED streetlights and yet 50% of a town’s energy spend can be on streetlights. LED lights can save 80-90% of the energy cost over traditional streetlights, they can report back their status (obviating the need to have staff checking for lighting failures) and they have a much longer lifetime, so they save on maintenance costs as well as energy.

It would be interesting to hear back from the InovCity people how much Évora is saving on lighting costs from the move to LED (even if only the energy savings) but even more interesting would be to try to see if the rollout of the smart meters and in-home displays has led to any sustained, per home, energy consumption reduction.

One last comment on this project – I can’t help but feel that the provision of in-home displays is an idea whose time has past. These days most people have access to a tablet, a smartphone or a computer where they can access this information. I suspect as the InovGrid project rolls out beyond the 35,000 inhabitants of Évora to rest of Portugal, the IHD’s will become at best, an added extra option, or quietly killed off.

Photo credits Tom Raftery

post

ArcelorMittal FCE roll out Organisational Risk Management software to unify maintenance processes

Organisational risk management (ORM) is the new hotness in the sustainability field. It is receiving increasing attention, as SAP’s Jeremiah Stone mentioned when I talked to him at SAP’s Sapphire/TechEd event last week. One assumes that it is receiving this increasing attention at least partly because that’s where the customer dollar is focussed right now.

What exactly is ORM? Organizational risk management is “risk management at the strategic level” according to the Software Engineering Institute – think of it as kind an amalgam of the traditional Environment, Health and Safety (EH&S) and Governance, Risk and Compliance (GRC) sectors.

How do these fit into the sustainability agenda? Well, risk mitigation is all about reducing the risks of an adverse event occurring – one that either hurts people or the company reputation (or often both!). It does this by mandating procedures and processes with verifiable sign-offs. It also does this by scheduling maintenance and raising alerts when equipment goes out of tolerance. This properly scheduled maintenance of machinery will ensure it not only runs safer, but often will also mean it stays more fuel efficient. This can mean significant energy savings in organisations which use a lot of power.

While at SAP’s TechEd/Sapphire last week I spoke with Edwin Heene, who works with ArcelorMittal and is responsible for the rollout of their ORM software solution. I had a quick chat with him to camera about the project and why ArcelorMittal embarked on it.

Here’s a transcript of our conversation:

Tom Raftery: Hi, everyone welcome to GreenMonk TV. We are at the SAP Sapphire event in Madrid, and with me I have Edwin Heene from ArcelorMittal. Edwin you have been involved in the organizational risk management project rollout or are involved in at the moment for ArcelorMittal. Can you tell us a little bit about that?

Edwin Heene: So in ArcelorMittal Flat Carbon Europe we are doing a global organizational standardization project in maintenance, that including also the safety processes and this is something that we do in several countries namely eight countries in Flat Carbon Europe.

Tom Raftery: So maybe we should give it a bit of context first. Who are ArcelorMittal? You are a large steel company, but could you just give us a little bit of background about the company first?

Edwin Heene: ArcelorMittal is the largest steel producing company in the world doing — covering about 6% of the annual year production. Has a number of employees about 260,000 in 2010. And presence in Flat Carbon Europe because that?s the sector where — segment where I work in. It is covering eight different countries, and we have about 35 locations in Flat Carbon Europe.

Tom Raftery: Okay, so as I mentioned in the start you are in the middle of this organizational risk management software rollout, can you talk to us a little bit about that?

Edwin Heene: So this system we — in 2008 we selected the fact the solution has update to the support us with this harmonization and there we found out that there was a good supporting tool for operational risk management and safety processes namely the solution was PWCM –Work Clearance Management solution.

Tom Raftery: Okay, and you brought SAP in to help you in a kind of collaborative role in developing the application for yourselves.

Edwin Heene: Yeah, because in Flat Carbon Europe we had already a number of plans that are on good level of safety and managing the safety risks and so on in the operational part with some legacy systems, with a decision to go to one common system, the SAP system, we have to convince the other people with, which have already a good supporting IT tool to move over to SAP.

And therefore we found out that there were some lags still in the supporting SAP PWCM solution. So we had a number of meetings with Jeremiah Stone from SAP who is leading co-innovation programs in SAP and there we decided to, in order to close these gaps to provide these functionalities in standard SAP environment to step in a co-innovation program with SAP.

Tom Raftery: Okay and why roll it out — what was the reason behind the rollout of the application?

Edwin Heene: The reason behind the harmonization and standardization program in Flat Carbon Europe is first of all to improve the maintenance processes in effect implementing all the best practices that we have in several plants and you have a best practice in every single plant to absorb that in one common model, one common business model and implement that in all different plants. Throughout this implementation of best practices you have business results, operational results in every single plant. Benefiting of being in a large group and learning from each other, learning from the best practice from another group.

Tom Raftery: Excellent, Edwin that?s been great, thanks a million.

Edwin Heene: Thank you.