
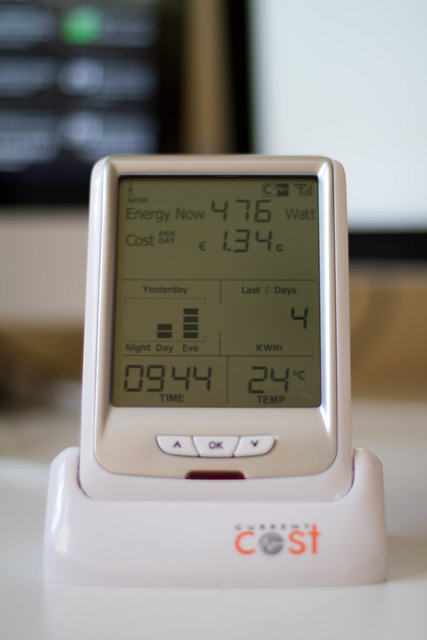
Photo credit Tom Raftery
I emailed Chris Dalby of Current Cost a question about their devices a few weeks ago. Chris, not only answered my question but also offered to send me one of their energy monitors to try for myself!
I love my Current Cost Envi 128. It is incredibly straightforward to setup – even I could do it, despite living in an apartment complex with no access to the electricity meter. I had mine up and running within minutes of receiving the delivery (I attached the clamp to the wire going into the fuseboard)!
One of the really great things about the Current Cost energy meters is that they can be connected to a computer. This may not sound like a big deal but it means you can use software from the downloads page to chart your energy usage in real-time as well as for storing historical data. This allows for fascinating comparisons of energy use across different scenarios.
Recently Current Cost announced they were partnering with Google to allow Google’s PowerMeter software to be used with Current Cost meters.

Google PowerMeter
The software for Google PowerMeter is available on the Current Cost site [after registration]. One disappointing aspect of the Powermeter software is that it is Windows only. Fortunately I have Windows installed (via Parallels) on my Mac so this wasn’t a major issue for me.
The biggest issue I came across with the Current Cost Envi and PowerMeter software is, if you want an accurate picture of your energy use, you need to leave your computer turned on running the PowerMeter software all the time! Obviously this is not very energy-efficient!
There is an historical data upload mode on the Envi. This allows you to upload data from the meter to the software in the case that the software wasn’t running (computer powered down, for example) but the historical data stored on the Envi is not at all granular, and worse, it overwrites the granular data which you had previously uploaded!
Current Cost say they are coming out with a Bridge device which will address this problem. Personally rather than forcing people into buying another device, I’d prefer if the software would simply not overwrite good data – that should be a simple software fix. The lack of granularity in the stored data is a tougher fix but I suspect could also be done via a software update of the Envi (while trading off the number of days’ data the Envi could store).
Apart from these niggles, I think the Current Cost energy meters are a superb way to visualise and track your energy consumption, something that is invaluable in helping to better manage your electricity usage.
I mentioned my concerns to Current Cost and asked for comment from them. As soon as they send me their comments, I will publish them here.
You should follow me on twitter here.
Hi Tom,
You can also check out Enio.co.uk. We also provide current cost support, with history uploads… We also only have windows software available at the moment, but have mac, Linux and current cost bridge support on its way.
Jon
Thanks Jon,
The Enio site is a bit bare on details atm – does the Windows software overwrite data when you upload, the way the Current Cost Google PowerMeter software does?
Also, I assume the lack of granularity in the historical data is a function of the Envi, and this is not something which can be overcome by the Enio software…
Good points but I think that the average customer will show great interest at 1st with their new meter (just like the Eon TV advert) but that this interest will diminish rapidly for 2 reasons;
1. the immateriality of energy costs to most households
2. It requires too much effort
Any systems that monitor energy must be very very simple and in a recognised format (like the iPad – you already know how to use it). Another gadget will fail.
In the future there is the false notion that a smart meter will make a smart customer. It will not until energy costs are big enough. These devices will only suceed when they sit on platforms that customers value for their other uses e.g. a mobile
The Envi stores history data in 2 hour blocks, so all that would be available is total kWh used over that period. As a result the graph would need to show this as a flat line indicating average consumption. I have not used the current cost software, so can’t comment on that, but we certainly show all real-time readings over history data on the graph where available.
We’re in private/invite only mode at the moment so there’s not a lot of publicly viewable information about the site, but if you tweet/email me, I can get you an account.
Jon
Thanks Jon,
I am away from home for the next few weeks but I may well take you up on that on my return (sometime in August)
The Google Powermeter thing is limited by the having to have a PC on all the time thing – quite annoying. I am waiting for Chris to send through a bridge device… 😉
The Enio stuff on the other hand is the next step – they kindly gave me an account and I have been playing – the great thing is that they give practical advice on power-saving, some of it based on your actual house and usage/appliances.
There is a way to go yet with Enio, which is why they are still in private mode (more appliances listed etc.) but I am really liking it and looking forward to having bridge support for it when my bridge comes.
The Alertme kit appears impressive as it already comes with a ‘bridge’ for a very low price £29.99 and works with Google powermeter (but no local display…) – I am about to try and get one to play with to compare, making a total of 5 energy monitoring devices in my house reminding me of the cost of running aircon and pool heating… 😉
Superb info – good to know Joe, thanks.
Of course, we’ll overlook the embedded energy in the manufacture, packaging, shipment of those 5 energy monitoring devices 😉
I lied, the alertme comes with a display unit for £49.99.
However you do have to pay £1.99/month for their online service, first 6 months included in package…
Tom,
Great review. Most of the low cost devices, like this one, are targeted at the residential market. There is a huge opportunity for commercial companies to reduce costs be tracking their energy usage throughout the day. Unfortunately, the standard energy monitoring devices sold to this market segment tend to be expensive – e.g. $2K + (US). Are you aware of anything similar to Current Cost that would be appropriate for a business with dozens of locations? I’ve looked at a number of energy management devices for my customers. It’s often cost prohibitive to install technology in each location, so many times they wind up doing nothing.
@Utility Management Guy – You may want to take a look at http://www.smeasure.org.uk/
@Utility Management Guy – also see http://smartenergygroups.com
@Utility Management Guy – another one worth checking out is http://www.luciddesigngroup.com/
Tom,
Thanks for the quick response. I’ll review these sites and share with our technical team. Prices for energy management systems and IDRs are dropping, but installation costs aren’t. It’s still $5K – $6K (US) per location in most cases. Hopefully, the technologies you’ve identified will help our customers save some money. I really appreciate the links.
No prob – let me know how you get on.
Hi Tom
Have a bridge unit for beta trial. Brilliant! Plug in register and your on 24/7.
I am on a Mac network at home so not having PC is now no issue.
Now the google part is good I also have the Power data and temperature data going to Pachube.
So now I can see in real time what my temperature and energy use, which was handy as I was showing a client when I noticed increased energy and called my wife to find she was home sick. Which meant I was cooking and fish and chips was enjoyed by all!
Tom:
I am curious how the “Bridge” is working for you… I agree that this function should be included. I am not sure that the Bridge is available yet – do you know what the cost will be? I would also like to know your thoughts regarding the power measurement technique. Some of these monitors use sensors which actually bolt on the residential meter and “look at” the spinning disk. Although this seems like a kludge, it is providing a reading which should be exactly what the power company will bill you for. It seems like the Envi device with it’s current probes does not account for power-factor, and thus will not accurately reflect “billable” power. Have you had continuous operation yet for a long enough time to compare your actual usage with what is measured by the Envi? If some of the heavier loads are inductive (for instance a heat pump), the measurement error could be significant.
-TomD
TomD – I don’t have a bridge so I can’t comment on that.
The power measurement technique of the Current Cost seems quite simple – it is a clamp meter. The clamp goes over the power cable going to the meter so it is measuring the power going through the meter but you are correct, it isn’t completely accurate.
The clock on the Envi is quite inaccurate, I can say that but I don’t have anything to compare the power measurements of the Envi against so I don’t know how accurate or otherwise its power measurements are.
We recently bought a Current Cost Envi. Easy enough to set up. We also got their data cable. Again, installing the driver was issue free. There it was on COM6.
So I thought there must be software that will allow me to ‘monitor the monitor’ live and download history to be able to assess usage trends. So that we could hopefully modify and reduce our usage.
This is where it’s all gone pearshaped.
First we tried the Google Powermeter. Install, set up etc no problem. It correctly identified our monitor and I waited, over a number of days, for the graph to show information. It remained empty.
I then read a post on the Powermeter group forum that you need to have your PC on 24/7. Call me pedantic if you like but surely that will increase my energy usage. I’ve always shut down our computers for the very reason that it saves energy. Like I turn off my monitor if I’m leaving the PC for short time.
Next I went to the Current Cost website and looked at the software they list. All the software listed has an “Overall Rating” of 4 stars. Now to me that means other people have used and rated the software. Though the fact that everything in the list had the same rating did seem a little strange.
Anyway I downloaded and installed the Techtoniq Energy Station. It showed live info from the meter and I could select different display options for historical data. The interface is, well, clunky but it seemed to provide what I wanted. The next day I opened the application. Blank. It seems you have to restart it every reboot even though I’d put a link in my Startup folder. It had saved a database which I tried to load only to get a message telling me it was in the wrong format.
Next I looked at Home Energy Monitor. It states in the description that “LabVIEW 8.6 or higher is required.” OK, what’s that? I found the LabVIEW website. Before I downloaded my 30 day free trial I checked the Buy LabVIEW page. The cheapest version costs $1249!
The other options are web based which I don’t need or particularly want.
The Currentcostgui by Dale Lane didn’t work.
There doesn’t appear to be any professional looking and working software available. Just amateur, clunky things that look like they were written for Win9X or Linux from the late 90’s.
The meter is great. Software support is abysmal.
Sorry I forgot to say we’re using Windows 7 64 bit on all three machines. One of which dual boots with Ubuntu 10.04 64 bit. I haven’t tried any Linux solutions yet but will do so.
Does anyone know if the bridge device can be pointed at alternative webserivces – is it possible to create your own “receiver” of this data. It appears reading the web that only power meter and pachube are supportted.
Any idea re the individual device monitor timetable also? Seems to be “coming” for a very long time.
We have been using the CC128 since May 2010. It’s great as a basic unit to monitor electricity usage and temperature. I have been graphing basic energy usage and have changed our use of electrical/electronic devices since. What I would like to see in this space is more development for individual appliance monitoring including individual enviroment monitors (meausure outdoor, other rooms, roof cavity temps), hot water temp monitoring, tank water guage monitoring, gas monitoring, water monitoring, and counters(example, count number of toilet flushs or number of times something is switched on & off).
Zigbee would be a great standard to integrate with these monitors to read smart meters. Battery backup is paramount to keep the clock working so that time and date is maintained. More flash memory and possibly a flip-up solar pnel to power the unit in the absence of a power supply will make the receiver much more attractive to users and hackers. More home sensing and monitoring information will empower users in making better informed choices on use if things and defining the optimum settings to save on energy usage and reduce waste in the home.
Hi the Bridge unit is a tester that I have, using it is for monitoring energy use not for meter data for billing. However using the Optical clamp you can get meter and billing data sent through the transmitter to the ENVI then to Google PowerMeter. I have noticed that people think it is a smart meter, it is not a meter. It’s a monitor to allow you to monitor your energy use. Current Cost are a Zigbee partner so expect some zigbee collaboration in the future.
Great review – these units are a lot of fun! Just thought I would share some more detailed analysis we did on the accuracy of the Current Cost monitor for those who are interested:
http://steplight.com.au/2010/08/08/how-accurate-is-the-current-cost-envi-energy-monitor/
We are now selling (in Australia) the successor to the ENVI (the “EnviR”). Full write-up here:
http://steplight.com.au/wireless-real-time-home-electricity-display/
I want to measure the energy consumed by a battery of a mobile phone for different applications. Can this meter be helpful for us in measuring those details.Can you please mention the range and ratings of this device. It would be better if you can give the cost details also.
These are usually run through prepaid electricity meters, where users buy vouchers worth given amounts of money which, when keyed into the prepaid meters, afford them given numbers of electricity units.
There is a great software that is not listed on the currentcost homepage. The setup is tricky but once done it will do great work.
http://code.google.com/p/measureit/
There is a significant flaw in the power meters when 220V is involved. The setting is 110 so by measuring the current one gets one half the actual power consumed. That is because there is no 220V setting on the transmitter setup. Thus on 220 appliances I have to double the power reading.