post

Rackspace claims cloud is Green but fails to provide data

Rackspace

Rackspace’s Director of Sustainability Melissa Gray, wrote a piece recently on the Rackspace blog titled The Greenest Computing is Cloud Computing.

Given that Cloud computing’s impact is a topic we cover regularly here on GreenMonk, we were excited to see a cloud provider address this issue, especially when this provider is one we have covered favourably in the past.

However, we were disappointed with the article due to it’s lack of any specific data to prove its case. Here are some quotes from the piece:

Every watt Rackspace uses is tracked — It came from somewhere (a power company, a generator) and it went somewhere (an office, a data center to power a server or power infrastructure).

Great – so how myuch power does Rackspace use, and what are its emissions?

We continually take steps to improve energy efficiency and reduce consumption of other natural resources.

Nice, so how much were Rackspace’s emissions in 2010, how much did you reduce them by in 2011, and what’s your target for 2012?

How much of those emissions were produced by your cloud infrastructure? And how much emissions did you displace by doing so?

We left the following comment on the Rackspace blog – it hasn’t shown up there yet, it is probably stuck in moderation somewhere (obviously they wouldn’t refuse to publish it):

Hi Melissa,

Nice article – well written but I notice you managed to avoid mentioning Rackspace’s emissions anywhere in the piece.

You need to publish some hard data to prove that “the Greenest computing is Cloud computing” – it is not enough just to say so.

If an organisation has an in-house email server, we can relatively easily measure its energy utilisation, and from that calculate its emissions. If it moves to a Rackspace server for the organisation’s email, we now have no way of knowing its emissions. If you are not publishing them, for all we know, their emissions are significantly higher than they were when they were in-house.

If, as you say, “Every watt Rackspace uses is tracked”, then it should be straightforward to report on energy use to your customers (my utility co. can do it). Will Rackspace do this? Or better yet, will Rackspace build this functionality into OpenStack, so all OpenStack users can do this?

Btw, I assume your new data center in Australia was sited based on access to renewables?

We await Rackspace’s response.

Image credit Scott Beale / Laughing Squid

post

Efficiency and Ecological Responsibility of Cloud Computing (including water footprint)

A BrightTALK Channel

Unfortunately the provider for this webinar requires a login to listen to this discussion. If you don’t wish to register, my username is [email protected] and my password is 000000

Mark Thiele from Switch recently invited me to participate in a webinar he was moderating on the Efficiency and Ecological Responsibility of Cloud Computing which took place yesterday evening.

Also participating in the discussion were Harkeeret Singh (aka Harqs) Global Head of Energy & Sustainable IT at Thomson Reuters and Jason Hoffman CTO and Founder of Joyent.

The discussion started off asking whether or not cloud computing is efficient and the panel was fairly unanimous in deciding that cloud computing is not efficient. The main point I made here is that because cloud providers are not publishing energy information, it is not possible to say whether or not cloud computing is energy efficient.

At around 15 minutes into the conversation, we shifted on to asking whether or not cloud computing is green. There was a good discussion on this with the fact that efficiency not necessarily being green being one of the main points raised. Also brought up was how plummeting costs of cloud computing are leading to an explosion in consumption – in itself not very green. And as a counterpoint Harqs raised the fact that lower costs are beneficial to start-ups in developing countries.

Then 33 minutes into the conversation, we started discussing the impacts on water of cloud computing. One point I raised is that if you run a 25kW rack for one hour the water footprint from electricity productions is:

  • 0.1 litres if the electricity comes from wind
  • 2.5 litres if the electricity comes from solar
  • 45 litres if the electricity comes from coal and
  • 55 litres if the electricity comes from nuclear (and this doesn’t include the considerable water footprint of uranium mining).

Nuclear power plants use phenomenal amounts of water. From the Union of Concerned Scientists report [PDF] on this

the typical 1,000 Mwe nuclear power reactor with a 30oF ?T needs approximately 476,500 gallons per minute. If the temperature rise is limited to 20oF, the cooling water need rises to 714,750 gallons per minute. Some of the new nuclear reactors being considered are rated at 1,600 Mwe. Such a reactor, if built and operated, would need nearly 1,144,000 gallons per minute of once-through cooling for a 20 degree temperature rise.

Actual circulating water system flow rates in once-through cooling systems are 504,000 gpm at Millstone Unit 2 (CT); 918,000 gpm at Millstone Unit 3 (CT); 460,000 gpm at Oyster Creek (NJ); 311,000 at Pilgrim (MA); and 1,100,000 gpm at each of the twp Salem reactors (NJ).

And that level of water consumption has big biodiversity effects – imagine the large water intakes required for a nuclear plant taking in one million gallons of water per minute. These water intakes don’t just take in water, they also take in any life forms in that water. None of these life forms survive going through a nuclear power plant obviously. And then there’s the heat pollution effects from the warmer water coming from the power plant outlets.

Towards the end of the discussion Jason asked if making this data available to end users would be a clear differentiator for Joyent. I responded that it would be because a) there is a demand for this information and b) because having seen how Greenpeace successfully went after Facebook, (and in their latest report are now targeting Apple, Amazon and Microsoft) for their dis-regard for the footprint of their cloud computing infrastructure, nobody wants to be the next company in Greenpeace’s sights.

Harqs added that any company pursuing such a policy should open-source it so everyone could contribute to the development of constantly improving reporting standards.

The highlight of the webinar for me was at 47:30 when Jason committed to doing just that.

All in all a superb discussion with a fantastic outcome. I hope you enjoyed it as much as I did.

post

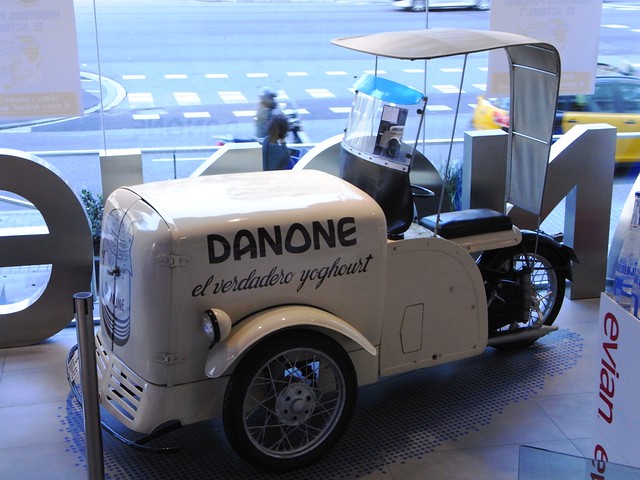
Danone’s carbon reduction collaboration with SAP has additional cost, recruitment and retention benefits

Danone

Most of the news these days is around energy efficiency wins, so it makes a welcome change to hear a pure carbon reduction story from Danone.

In 2008 Danone set very aggressive carbon reduction goals for itself. It decided to reduce its carbon emissions 30% by end of year 2012. This was a deliberately ambitious aim because it meant galvanising everyone in the company to become involved, if the aim were to be met. On a call with Danone CIO Jean-Marc Lagoutte last week I learned that Danone have already passed their 30% target – an impressive achievement.

How did they do it? They used a combination of information and incentives. On the incentives front, 30% of every plant manager’s bonus was made dependent on carbon reductions. While on the information front, Danone rolled out a carbon calculation and management system which made the full lifecycle carbon emissions of every aspect of every one of Danone’s 35,000 products readily available.

Danone teamed up with SAP to co-innovate on this project. SAP was an easy choice according to Lagoutte because Danone was already an SAP house, so the majority of the data their carbon system would need was already in their SAP system. It has now been rolled out to the majority of Danone’s affiliates and should be in all of them by 2013. Danone is hoping that this will become a standard offering from SAP so that it will be covered under SAP’s standard maintenance contract. SAP in turn have said that they do plan to offer the solution to new customers.

Next steps for Danone, said Lagoutte, include calculating the water footprint of its products, the effect on biodiversity and when labeling standards have been reached, making that information available to consumers.

Internally in Danone, a carbon master has been appointed for every country business unit. The carbon master is in charge of carbon reductions for that business unit. Making one person per unit responsible and arming them with the information the need to affect that change was obviously critical to the success of this program (that and the incentivising of the plant managers to ensure buy-in).

I asked Jean-Marc if it were just the carbon footprints’ of their products ingredients which were considered but he said that no, it was everything in the lifecycle, including their suppliers’ carbon footprints and the packaging. In fact, several of the carbon reduction wins that Danone achieved came from reductions in packaging. Four packs of Danone yoghurt sold in France had a cardboard surround. This has been done away with, for example, with a consequent carbon footprint reduction.

Other changes were to substitute the PET used in plastic bottles with a mix of recycled plastic and bio-plastic (from cane sugar). This change reduced the carbon footprint of Actimel bottles by 70%.

As well as reducing Danone’s carbon footprint, this project is also saving Danone significant costs on several fronts. PET was one of the most expensive ingredients which Danone used. Substituting bio-plastic, not only reduces Danone’s carbon footprint, but saves them money as bio-plastic is cheaper. Other packaging reductions also lead to easy cost and carbon reductions.

Also, this project led to Danone’s needing to revisit all their processes, many of which hadn’t been examined in quite some time. This re-assessment identified inefficiencies and led to many reductions and simplifications of processes.

And because all purchasing contracts had to be re-negotiated with a carbon dimension, all of Danone’s suppliers had to sell themselves once more to Danone. This led to big improvements in the supply contracts.

Finally, the carbon reduction program generated a lot of internal pride in Danone around the company’s goals and achievements. This has led, according to Lagoutte, to significant recruitment and retention benefits for Danone.

A win for the planet, a win for SAP and several nice wins for Danone!

Photo Credits Tom Raftery and sashafatcat

post

Friday Green Numbers round-up for July 8th 2011

Green Numbers

With the summer slowdown in travel, I’m re-instating the Friday Green Numbers Round-up – and so without further ado…

  1. Whitehall surpasses 10% CO2 reduction target

    Whitehall has surpassed its target of slashing its CO2 emissions by ten percent in one year, achieving a cut of almost 14 percent.

    Prime minister David Cameron said central government emissions have fallen by 13.8 percent in the past year, reducing energy bills by an estimated ?13 million.

    Topping the table was the Department for Education, which achieved a 21.5 percent cut, while the… Read on

  2. Britain’s richest man to build giant Arctic iron ore mine 300 miles inside Arctic Circle

    Lakshmi Mittal’s ‘mega-mine’ is believed to be the largest mineral extraction project in the region but threatens unique wildlife

    Britain’s richest man is planning a giant new opencast mine 300 miles inside the Arctic Circle in a bid to extract a potential $23bn (?14bn) worth of iron ore.

    The “mega-mine” ? which includes a 150km railway line and two new ports ? is believed to be the largest mineral extraction project in the Arctic and highlights the huge… Read on

  3. Amazon Resists Pressure To Disclose Data On Carbon Footprint

    Amazon revolutionized the retail industry in the United States, and for several years has had a strong presence in Europe and Asia. Its market cap among retailers lags only behind Walmart.

    Despite its successes, the e-commerce giant has attracted criticism for a perceived lack of transparency of its carbon footprint…. Read on

  4. Facebook in the top 10 most hated companies in America

    Business Insider posted an article titled ?The 19 Most Hated Companies In America.? The data was based on the American Customer Satisfaction Index (ACSI), which releases industry results monthly and updates its national index quarterly.

    Facebook was placed at number 10. I decided to take a look at just the 2010 data, which is the latest available if you want to see ratings from all the companies in the US…. Read on

  5. 7 ways cloud computing could be even greener

    Forrester Research is the latest organization to explore the link between cloud computing and green IT.

    Forrester notes that by its nature, cloud computing is more efficient. But here are seven ways that an IT professional can make his or her cloud computing even greener ? regardless of whether or not the approach is public or private:…. Read on

  6. E-On investing $600 million in Illinois wind farms

    Northwest of Kokomo, along U.S. 24 near the Indiana-Illinois state line, the horizon is broken by the sight of dozens of wind turbines slowly turning in the breeze.

    There, in the small town of Watseka, Ill., E-On Climate & Renewables is putting the finishing touches on the Settler’s Trail Wind Farm, and the company soon will start work on the Pioneer Trail Wind Farm in a neighboring portion of Iroquois County.

    E-On also plans to construct a major wind farm across parts of Howard, Tipton, Grant and Madison counties.

    Construction on Phase 1 of the Wildcat Wind Farm is…. Read on

  7. UK’s two biggest solar installations start generating energy

    A huge solar farm in Lincolnshire and another in Cornwall started generating green electricity on Thursday to become the UK’s two biggest solar installations, as developers rushed to beat an imminent cut in government subsidies.

    The 1MW Fen Farm solar park and the 1.4MW Wheal Jane park in Truro are two of several such large-scale projects rushing to connect to the grid. They are trying to benefit from a…. Read on

  8. Missing: 163 Million Women

    AMidway through his career, Christophe Guilmoto stopped counting babies and started counting boys. A French demographer with a mathematician’s love of numbers and an anthropologist’s obsession with detail, he had attended graduate school in Paris in the 1980s, when babies had been the thing.

    He did his dissertation research in Tamil Nadu.

    As it turned out, Tamil Nadu was in fact one of the states where girls had a better prospect of survival, while in 2001 the northwest, a wealthy region considered India’s breadbasket, reported a regional sex ratio at birth of 126?that is, 126 boys for every 100 girls. (The natural human sex ratio at birth is 105 boys for every 100 girls.) The cause for this gap, Guilmoto quickly learned, was that pregnant women were taking advantage of a cheap and pervasive sex determination tool?ultrasound?and aborting if the fetus turned out to be female… Read on

Photo credit Tom Raftery

post

The kind of commitment to sustainability which Xerox demonstrates is very rare. It should be the norm.

Xerox power button

I had a phone call recently with Patty Calkins. Patty is Vice President of Environmental Health & Safety for Xerox Corp. I knew Xerox had a good environmental record but until talking to Patty, I had no idea just how good!

To put this in context, let’s take a quick look at how long they have been thinking about their environmental impact, as a company –

  • Xerox invented double-sided copying in 1969
  • In the early 1970’s Xerox introduced the 1st post consumer recycled paper products
  • In early 1980’s Xerox introduced products which automatically powered down (before Energy Star program was conceived)
  • Xerox was a founder member of Energy Star
  • In the 1980’s Xerox started rolling out its supplier requirements program
  • In early 1990’s Xerox started focussing in on the end-of-life of products in the design phase – designing in end-of-life considerations for asset re-use.
  • In late 90’s Xerox established a waste-free platform to design waste-free products, to manufacture in waste-free facilities, to enable waste free customer sites.
  • Then Xerox initiated a cartridge return program so Xerox designed cartridges for remanufacturing
  • In the early 2000’s Xerox kicked off its carbon footprint reduction program – called Energy Challenge 2012. The initial goal was for Xerox to reduce its Carbon Footprint by 10%, over its 2002 base year, by 2012, in absolute terms. By engaging the workforce, Xerox managed to shoot right by that target and hit 18% reductions by 2006. Xerox then upped it’s CO2 reduction target to to 25% by 2012. As of 2010 blew past that goal achieving 30% reductions against its 2002 baseline. Now Xerox are in the process of re-baselining because of the acquisition of Affiliated Computer Systems in early 2010. Xerox will use its 2010 figures to establish a new baseline and will announce its next carbon reduction goal.

Given such a stellar record, I shouldn’t have been surprised at how seriously they take sustainability at Xerox, but I was. Why? The phone call with Patty was incredibly information dense but I’ll try to sum up some of Xerox sustainability highlights.

Most organisations have far more print capability than they need and the print devices they have have an average utilisation rate of around 1-2%. The rest of the time, they are still drawing power, requiing maintenance, etc. To help organisations with this issue, Xerox works with their clients advising them how best to replace stand-alone fax machines, printers and copiers with shared multi-function devices. Xerox took it a step further and developed their Sustainability Calculator – which allows companies to do before and after scenarios to see potential savings and also to subsequently qualify savings from ‘right-sizing’ their print infrastructure.

Xerox Sustainability Calculator

Xerox Sustainability Calculator

Again on the customer saving front, Xerox developed solid ink technology. This is where they supply ink for printers in solid waxy cubes. The ink melts in special wells in the printer and can then be printed onto paper. The advantage of the solid ink technology is there are no ink-jet cartridges, or laser toner cartridges to dispose of/recycle, and less packaging, transport and storage. In fact, solid ink generatres 90% less waste than laser cartridges. Over the product?s entire life, it actually consumes roughly 30% less overall energy and Earth?s resources than an equivalent color laser printer according to this peer reviewed report [PDF] on the lifecycle impact of solid ink.

Then around five years ago Xerox decided to take a step back to re-examine its aims and to see what is the ‘next plateau’ to reach for in this space.

Xerox mapped it’s complete environmental footprint, identified the significant environmental aspects, went out and tested it against various stakeholders, processed the data and organised it into newer sustainability framework which now consists of 4 planks (with associated goals):

  1. Climate protection and energy with a goal to ultimately become carbon neutral (no date yet set so the top priority for now is to reduce energy consumption)
  2. Preserving biodiversity in world’s forests by driving towards a sustainable paper cycle
  3. Preserving clean air and clean water – 2 goals i) zero persistant bioaccumulative and toxic material and ii) to become water neutral and
  4. Waste prevention and management with the goal of designing waste-free products, to manufacture waste-free facilities, to enable waste-free customer sites

According to Patty, Xerox have (funded by the Xerox foundation) spent millions on research into preserving the world’s biodiversity and turning that research into action in partnership with The Nature Conservancy.

And Xerox have been extensively researching the health impacts of human exposure to toner for the last 30 years. Perhaps unsurprisingly given it is Xerox they say it is not harmful – the difference here though is that they can back up this claim with peer reviewed studies on over 30,000 people over 30 years. Hard to argue with that!

The kind of commitment to sustainability which Xerox demonstrates is very rare. It should be the norm. Hopefully the more Xerox tell their story, the more they will inspire others to shine too.

You should follow me on Twitter here

Photo credit Craig A Rodway

post

Microsoft System Center Configuration Manager R3 has Power Management functionality built-in

Microsoft recently released in Beta the R3 version of its System Center Configuration Manager 2007.

Microsoft Corporate VP Brad Anderson, introduced it at the Microsoft Management Summit 2010 saying

The most significant change to the System Center Configuration Manager in R3 is the new power management set of strategies.

By way of background Brad talked about how an increasing number of RFP’s being received by Microsoft were requesting information on what Microsoft was doing to reduce its footprint. According to Brad, reducing your energy footprint is now an imperative to doing business, not just a way of saving the company money.

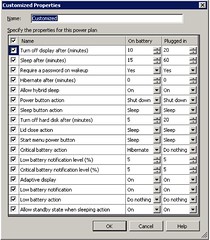
Microsoft System Center Configuration Manager 2007 R3

System Center Configuration Manager 2007 R3 config screen

Microsoft’s System Center Configuration Manager allows systems administrators to centrally control all kinds of policies on client servers and PCs on a network. Everything from what appears in the Start menu right through to security management policies can be deployed using this software (aside – as a sysadmin of a small co. back in the early 00’s I used the config manager to set people’s wallpaper on their PCs to a html version of the co. phone book!).

The ability to control the energy policies of client PC’s is hugely important because that’s where the maximum number of CPU’s is in most organisations. The Ford Motor company, for example, recently announced that by rolling out 1E’s Nightwatchman PC energy management application it was going to save

$1.2 million and reduce its carbon footprint by 16,000-25,000 metric tons annually

1E are a Microsoft partner and their NightWatchman product goes significantly further with PC power management according to Microsoft’s Rob Reynolds, Director of Product Planning for System Center, who briefed me on the new System Center Configuration Manager (config manager will only put PC’s into Sleep Mode, for example, whereas NightWatchman can shut them down completely and NightWatchman has significant power management controls for XP clients which config manager is missing).

The new software gives you

  • The ability to see and set how and where the power is being used
  • The ability to see what your user activity looks like
  • A set of recommendations on policy to show you how to reduce your power consumption and
  • Tracking and reporting on how much carbon you have prevented from being released as a result of your power management capabilities

On the server front, Rob outlined a scenario where based on reduced demand (overnight, say), virtual machines can be re-provisioned onto fewer hosts and then some of the servers could be put into a low power state. Then as demand picks up once more (following morning) the servers in low power mode can be woken back up and the virtual machines moved back onto them.

While many products such as NightWatchman already exist with this functionality, having it built into Configuration Manager will now put this within easy reach of all Microsoft customers and that can only be a good thing.

post

SAP’s latest Sustainability Report is teh awesome!

SAP's 2009 Sustainability Report using OAuth!

SAP released its 2009 Sustainability Report during the week and if last years Sustainability Report was good, this one is outta the park!

SAP released their first Sustainability Report in November 08 reporting on the 2007 year. It was a good initial effort (prepared in accordance with the GRI guidelines and achieving a ?C? level certification) delivered in your typical PDF format. The main innovation the first year was that there was a separate site for readers to leave feedback.

Then in May 2009 SAP released their 2008 Sustainability Report. This report achieved a B+ GRI rating and was far more interactive than the previous report (or any Sustainability Report I had previously seen). It allowed readers to interact with the data and showcased the interactive Sustainability Map which categorised core business processes related to sustainability and mapped them into distinct categories. Again SAP solicited feedback from users.

Now the 2009 Sustainability Report takes this to the next level. It:

  • achieved an A+ GRI rating by reporting on more sustainability GRI indicators and by adding new metrics, including Renewable Energy, Business Health and Culture Index, and Employee Satisfaction
  • includes the new edition of the Sustainability Map
  • establishes short- and long-term goals for many of SAPs metrics beyond carbon footprint
  • contains more embedded interactive dashboards leveraging data sourced from SAP Carbon Impact and SAP Business Objects Sustainability Performance Management
  • enables readers to comment on SAPs performance and solutions in the context of the report (no longer on a separate site) and
  • SAP will now produce quarterly updates on their carbon performance

There’s also the Materiality Matrix and the Create Your Own sections where you can try out different scenarios to see how they would affect SAP’s goals.

What do I love about this report?

  • I love how the two co-CEO’s went beyond simply putting their name to a letter at the start of the report (that’s so 2009!). They took the time out to record videos to introduce the Sustainability Report and talking about SAP’s commitment to sustainability.
  • I love the ability to leave comments on every page. The comment system allows you to login using your Twitter, LinkedIn, Yahoo, FaceBook, Google, or AOL credentials and uses OAuth for account verification. The geek in me just loves that (hence the screenshot above).
  • I love how the performance summary presents the data in stunningly simple to digest format. Clicking on the data here drills down into more detail on those numbers. The detail section is often highly interactive. For example in the carbon footprint section of the report you can see the carbon footprint by quantity, or by employee, by region or overall, by emission scope and clicking on a year gives a breakdown for that year specifically. Also, clicking on the printer icon allows you to print, while clicking on the Excel icon lets you download the data! and
  • I love how this report makes SAP’s sustainability data and their targets so transparent

Scott Bolick, SAP’s VP Sustainability Solutions, informed me that readership of SAP’s Sustainability report went from 3,500 for the 2007 PDF report to approx 30,000 readers for the online 2008 report. On top of that, many of SAP’s customers after looking at it, asked if they could purchase the technology to produce a similar report themselves! That’s a ringing endorsement right there.

It will be interesting to see what the readership of this report will be – you gotta suspect it will blow way past the 30,000 that last year’s report had.

[Disclosure – SAP are GreenMonk clients]

post

Friday Morning Green Numbers round-up 04/16/2010

Green numbers

Photo credit Unhindered by Talent

And here is this week’s Green numbers:

Posted from Diigo. The rest of my favorite links are here.

post

Friday Morning Green Numbers round-up 03/26/2010

Green numbers

Photo credit Unhindered by Talent

Here is this Friday’s Green Numbers round-up:

Posted from Diigo. The rest of my favorite links are here.

post

Make people responsible for their energy use to drive down consumption!

Joe Baguley wrote a fantastic post recently on the HomeCamp blog on monitoring energy use in the home. It is a really good read as Joe outlines how he first became interested in home energy monitoring and over time evolved into the “home energy enforcer” (!). He goes through the tools he employed to monitor his home energy use and how, as he evolved to more granular and network accessible information, he was able to make even greater savings on his electricity bills.

What is even better though is how the first comment on the post came from his father, who said:

Pity he did not do this for the 20 plus years he lived at our house, the only way he saved energy then was to lie on the settee and wach me mow the lawns! He neven opened his bedroom curtains as it was easier to reach out of bed and turn on the light.

So there are two very important lessons to be taken from this post:
1. The more information you have about your energy consumption, the easier it is to reduce it and
2. One of the greatest incentives to reducing your energy consumption is having to pay the bills.

Joe didn’t worry about saving electricity while living with his parents, but now that he is paying for his electricity himself, reducing his energy footprint (and by extension his carbon footprint) has taken on a whole new level of importance. As he said himself:

What drove me to do all this was not only a fascination with tech, but more importantly a fascination with not wasting money. Not saving the planet – saving cash. In my experience cash beats morality every time…

I wonder, within businesses, would the best way to reduce energy usage be to expose energy usage information to all the employees (broken down facility, by department and even by individual)? Then make energy reduction part of people’s KPI‘s.

By extension, when electricity information in the home is granular enough, would a good way to reduce it be to assign energy budgets to all the members of the house (especially the kids!)?