post

SAP releases its Integrated Report 2012 – an integrated financial and sustainability report

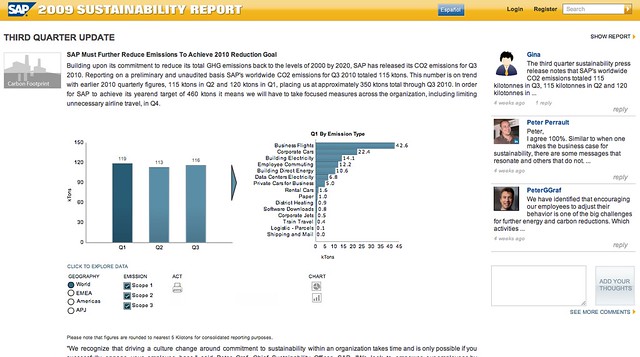
SAP released their first Sustainability report in 2008 (their 2007/2008 report). Like the reports of most other companies at the time, it was released as a PDF document but SAP quickly shifted gears. SAP’s 2008 Sustainability report, was released as a website. This had the dual purpose of making the site more accessible, and also allowing SAP to see which areas of the site had more traction. The following year they made their report more social and every year since they have added something new.

As well as releasing its Sustainability reports each year, SAP also published its annual financial reports. This year, for the first time, SAP have integrated the two reports and they have just published their SAP Integrated Report 2012. It takes the form of a highly interactive website with built-in analytics and downloadable PDF’s.

This was an idea GreenMonk first mooted when I asked SAP’s Chief Sustainability Officer Peter Graf in a 2011 interview whether SAP had any plans to integrate the two documents.

On a conference call at the launch of the integrated report, SAP Chief Accounting Officer Christoph Hütten went to great pains to stress that this wasn’t merely the content of both reports in one, but that the content was very tightly bound together. The report demonstrates how connections and inter-dependencies between financial and non-financial performance impact each other, he said.

The document/website contains all the financial and sustainability-related information you would expect to find in reports of this type. And the report also has a nice page showcasing and explaining the connections between the financial and non-financial performance.

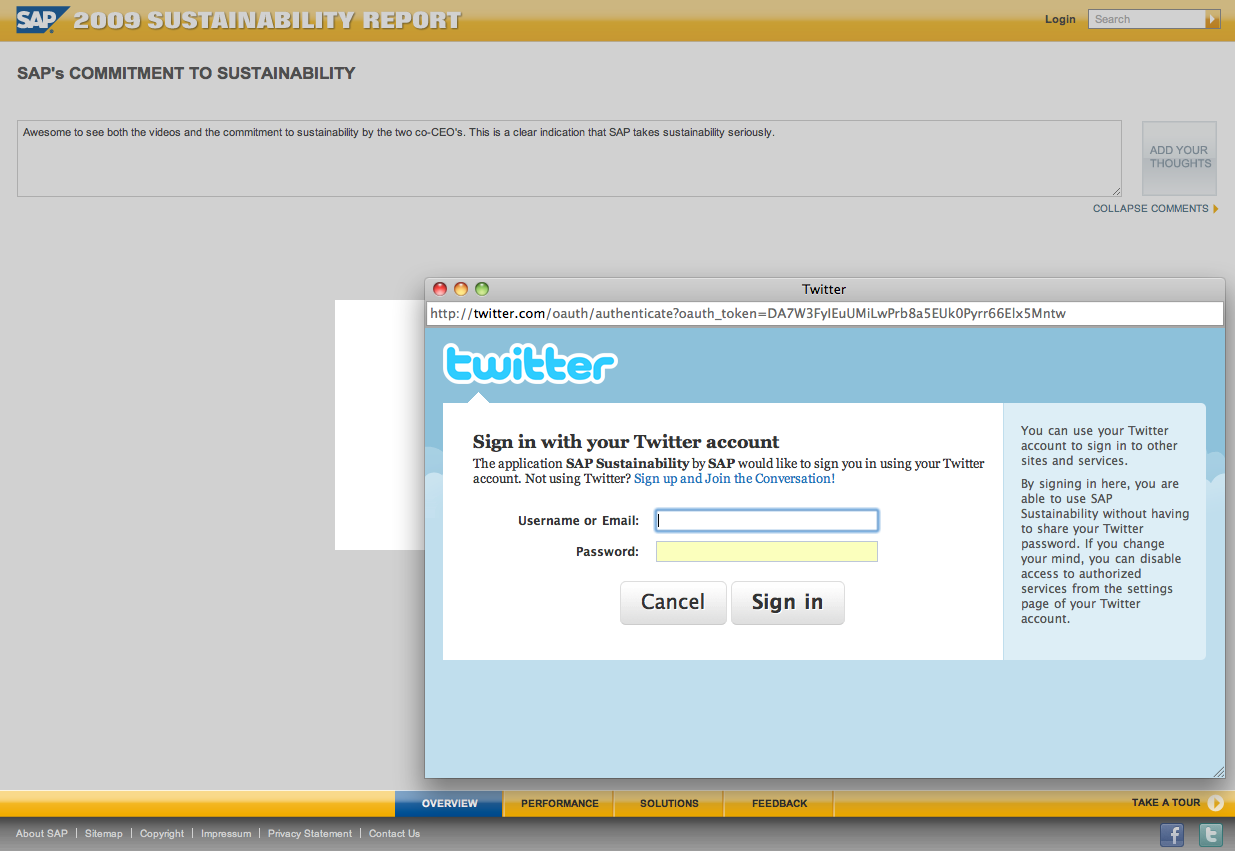
Other nice features of the report are an integrated tweetstream showcasing mentions of the #sapintegrated hashtag on some pages, an option to make notes on pages (with the ability to download those pages as PDF’s subsequently), and the download centre for downloading the annotated pages, as well as financial statements, graphics and other reports.

For the first time also, SAP are releasing their 2012 sustainability information in XBRL format (.zip file) – something GreenMonk also suggested to SAP back in 2011. If you are unfamiliar with XBRL, it is an XML-based global standard for exchanging business information.

Impressive as well was the fact that at the end of the conference call launching the report, Peter Graf mentioned that SAP are actively looking to co-innovate. He asked that anyone, be they in the financial or sustainability reporting space, who is interested in integrated reporting get in touch with him to work together to bring integrated reporting to everyone “at the lowest possible cost and highest possible precision”.

The video above is a demo of the report and I have placed a transcript of the video here.

post

SAP’s 2011 Sustainability Report

SAP 2011 Sustainability Report

SAP launched its 2011 Sustainability Report this week and in terms of aesthetics and social sharing, this is one of the best Sustainability Reports I have seen to-date.

The site contains many videos with SAP staff – including one from co-CEO’s Jim Hagemann Snabe & Bill McDermott which is featured prominently on the home page. Interestingly there are also several customer reference videos as well with the customers vouching for how SAP have helped them become more sustainable.

There are also many blog posts and interesting stories from SAP employees talking about everything from Materiality, through to Electric Vehicles.

There is a whole section in the report dedicated to how SAP Empowers its customers. It includes customer video testimonials, white papers and some very impressive top line figures for savings (“5.7 million tons of estimated carbon reductions, saving $550 million in energy costs”). However the methodology for producing these data is not gone into in any detail in this section. I contacted SAP to voice my concerns about this and they assured me that in the next couple of weeks the report will be updated to include the methodologies, and the story around producing this innovative section of the report.

SAP's progress on sustainability

As you’d expect from SAP, there’s also a lot of data in the report on how they are doing on their journey to sustainability and it’s mostly positive results. Almost all of their numbers are headed in the right direction. Unfortunately the exceptions to this are in the environmental area with increases in Data Centre Energy, Total Energy consumed and SAP’s Greenhouse Gas Footprint.

On the data centre energy front, the energy increase is both in real terms, and in kWh per employee. This is likely due to SAP increasingly hosting customers data and applications through their cloud offerings. What might be interesting here would be to see a kWh per cloud customer metric, or similar. Also, one would suspect that there should be a net reduction in energy consumption for that application, if it is replacing a customer’s pre-existing on-premises application. There could be some interesting data to mine there around energy wins.

On the Total Energy Consumed page you see that energy consumption has increased from 843GWh in 2010 to 860GWh in 2011. In the report it attributes this to growth in the business (SAP bought SucessFactors during this period) but the lack of a kWh per Employee metric on this page makes this hard to verify.

On the Greenhouse Gas page, we again see an increase in emissions from the 453kTons 2010 figure to 490kTons in 2011. On this page, it is possible to see a By Employee figure and here too we see an increase in emissions from 8.7 tons per employee in 2010 to 9.0 tons in 2011. However, when we look at the emissions by ? revenue, we see a fall, from 36.3g/? in 2010 to 34.4g/? in 2011. 2011 was a good year for SAP, from a revenue perspective, it would appear.

On the upside, SAP has increased its use of renewable energy from 45% to 47%. Not a huge increase, to be sure, but at least this environmental metric is going in the right direction.

I mentioned that the site has a lot of social sharing built into it – there’s a “Share this page” on every page which allows you to share that page on your social network of choice (or print, or email!). However, in terms of interactivity, the report seems to have regressed. In the 2010 report, there was the ability to comment directly on any page, to rate comments, and see conversations taking place about the page, directly on the page. This functionality has been removed completely from the 2011 report, and to be honest, the report is the poorer for its removal. Browsing other readers comments on pages is always a superb way to gain others insights into the page content – both for consumers of the report, as well as for SAP.

From a UI perspective there are several glitches on the site (some rollovers not working; external links and links to PDF’s not made obvious; and inconsistent use of pretty permalinks etc.) but these are minor quibbles and easily fixed.

The 2010 report doubled individual visitors over the 2009 report, with the 2010 report receiving over 60,000 readers. SAP tell me they are aiming to maintain that progress and have over 120,000 visitors to this, the 2011 report. One huge advantage of having the report in the form of a website, is of course the invaluable data stream you receive from the visitor analytics to the report. Something which is impossible to achieve with a PDF.

On the whole, SAP’s 2011 report, with the removal of the interactivity and the increased energy and emissions, seems to have faltered slightly in terms of the tremendous progress it had been making to-date. To put that in perspective, SAP’s 2011 report is still one of the better produced sustainability reports.

For the 2011 report I’ll have to grade it as “very good, but could do better”.

Photo Credit Tom Raftery

post

SAP’s sustainability customers are talking up SAP!

Cash register

When I interviewed SAP’s Jeremiah Stone last May about SAP’s Sustainability story at SapphireNow, he mentioned that SAP was committed to an increasing focus on sustainability customer success stories

I?m excited to hear less about SAP being sustainable in our vision and a lot more about SAP?s customers embedding our technology to have more sustainable business and more sustainable products of their own.

At SapphireNow, according to Jeremiah, around 80% of the Sustainability events were customer-led.

SAP seems to have continued that momentum, having recently published a series of videos of customers talking to SAP about how SAP’s sustainability solutions boosted their Sustainability programs. There are interviews with Lexmark, CSC, Dow, Air Products, amongst others.

It is one thing to be reporting on your own sustainability initiatives, as SAP do in their online Sustainability Report, but quite another when you can roll out customers who are willing to go on record saying your products helped them become more sustainable. That definitely helps take the credibility up a notch.

Now, imagine if you could quantify the sustainability savings your customers have achieved as a result of deploying your software…

Photo credit skpy

post

SAP’s 2010 Sustainability Report demo’d

I had a Skype chat recently with SAP’s Chief Sustainability Officer Peter Graf where he gave me a demo of their new 2010 Sustainability report.

With Peter’s permission, I recorded the demo for publication on YouTube. The video above is the result and the transcription is below.

Some highlights Peter mentioned include:

  1. More sustainable operations have saved SAP ?170 million (!) between 2008 and today,
  2. SAP are updating their Sustainability report quarterly and are embedding it more and more closely with their financial reporting and,
  3. SAP have deep social media embedding in their report

With this report, SAP have put clear blue water between themselves and any other sustainability report. SAP can still take it up another few notches (productising it, putting an api in front of it, publishing in xbrl, etc) but this is the kind of reporting everyone needs to be moving to, as a baseline. Kudos to SAP for once again setting the bar with this report.

Now here’s the transcription of the demo:

Tom Raftery: Hi, everyone. Welcome to GreekMonk TV. We are talking today to SAP?s Chief Sustainability Officer, Peter Graf, who is going to give us a quick demo of the new 2010 SAP Sustainability Report.

Peter Graf: So, this is SAP?s 2010 Sustainability Report, which people can find online at sapsustainabilityreport.com. The report lays out the three key areas of impact for SAP. In the first place, SAP wants to become a more sustainable company, so we are talking about our own sustainability performance. The second section of the report is about how SAP helps customers to run more profitably and sustainably, so that?s mostly a conversation about our applications and software solutions.

And then finally, there is a section on how people at SAP drive opportunity for others through IT. And then, certainly the last part, as always when we put our report on the line is that encouraging into action and dialog between us and those who come and visit the report. And we call that section Do Your Part and that describes how everyone can contribute.

Tom Raftery: Great. Can you show me some of the details of how SAP have done in the last year? How does it look onscreen, because it?s very different from any other sustainability report that?s out there?

Peter Graf: Exactly. So before we go there, the data that we talk about is all assured by KPMG, and there are two levels of assurance and yes, this report is A+ from GRI perspective. It?s got the best rating that you can get from GRI. It complies with a whole variety of standards, but most importantly, we have not only done limited assurance to our greenhouse gas numbers, we?ve actually gone for reasonable assurance, meaning the assurance company actually assures that this is really our footprint. And we do that because we believe in the future there will be much more scrutiny around how people are reporting greenhouse gas emissions.

And that?s what the greenhouse gas emissions look like. You can see the trend from 2000 to 2007; we?ve always increased our emissions. In 2007, we set ourselves the goal to reduce our emissions step-by-step back to the level of 2000 by the year 2020, so we have an absolute carbon target. That is pretty aggressive considering that in 2000, we had about 24,000 employees and already today in 2011, we have more than 50,000 employees and we want to obviously continue to grow as a company.

You can also see that we have kind of flipped the chart to kind of visually highlight that emissions are seen as a liability to SAP so they show below the line.

Tom Raftery: And clicking on any of those bars redraws the kind of pie chart on the right?

Peter Graf: Exactly, so you can go and drill into the different years and you can see how the emissions change. For example in 2008, we had 31% of our emissions from flights that also tells you that we include Scope 1, 2 and 3 emissions in our calculation.

That number dropped dramatically in 2009, given that in the times of economic crisis, we just don?t service as many customers, so you can see that here. And then in 2010, the number continues in absolute terms to be reduced, which is amazing given that we have actually increased our revenues by 17% in 2010 while reducing our emissions. You can see that very nicely when you look at the carbon emissions on a Euro basis. We are now at 33.9 grams per Euro revenue and in 2008, that number was 45.6 grams.

So, in terms of carbon efficiency we have dramatically accelerated and you can drill into different areas. For example, revenue in the Americas, you can actually go and look at different scopes and include or exclude them in the competition. So that?s the benefit of having this kind of interactivity.

Tom Raftery: The obvious question that comes to mind then is, if you are spending all this money on getting carbon out of your system, out of your organization, it must be costing the company a small fortune.

Peter Graf: Yeah, that?s the secret sauce I would say, because what we do at SAP is from the carbon perspective, we have a very, very good idea about where we need to kind of have activity in order to have a positive financial impact. So, here you see the SAP specific abatement cost curve that we have, which is produced with the help of SAP carbon impact and you can see, for example, for every ton of carbon that we avoid using video conferencing, the company saves ?654 and there are 39,000 tons that we can abate that way. So, the width of every one of those rectangles describes how much carbon we can save, the height describes the financial impact.

We have done an analysis in terms of a business as usual case, so we extrapolated our carbon performance from the 2000 to 2009 further into the future in the business as usual case and in comparison to that business as usual case Tom, we saved ?170 million. So, 170 — so it looks like this is expensive stuff, but in reality for us, we live the sustainability business case and we are bringing in savings by becoming more energy efficient.

Tom Raftery: So, you are also going beyond not just in terms of presentation and interactivity, but you are also going beyond what most of the companies are doing as well by reporting not just once a year or not just once every two years as some companies are doing, but once every quarter?

Peter Graf: That?s correct. And we?ve just announced our first quarter results. We have a 6% increase in carbon for the first quarter of 2011, which we can easily track to a 5% increase in employees and we have had a very, very good performance last year in terms of carbon, so we need to keep on our toes and do the right things.

I want to highlight one element which is our increasing renewable energy, which went from 16% to 48% last year globally. Again, you can see the type of charts we used. Below the line, we have fossil and nuclear sources for electricity; above the line, we have renewable sources like wind and hydro. So there is a big shift going on between 2009 and 2010, how we source our electricity and the beauty of this chart, below the chart we show how we do less bad and above the chart we show how we do more good and the change is pretty significant.

I mean, look in 2009, we had probably 16% total renewables and the number has grown so much. While in addition, the absolute number of gigawatt hours of electricity we consume has been reduced to 268 from 301. So, our strategy is to reduce the distance from this point to that point and at the same time shift the whole thing up.

Tom Raftery: Are you doing any — or have you plans to do any integration with your financial reporting?

Peter Graf: This report is actually launched in an integrated fashion with our financial report. So for example, if I go and look at the overall performance and I?m interested in revenues for example, if I click on that what is happening is that I?m branching out to SAP?s annual report. So, there is no redundancy and the way how these reports are designed you know, there is — from a layout perspective the same kind of branding and so, the two reports are interconnected, so we avoid redundancy.

We are not yet in one report, but we have taken a significant step, because we are launching these reports at the same time on the web and they are linked with each other. So, that?s an intermediate step, but the trend certainly goes to what one report is.

Tom Raftery: Last question, I?m a big user of Twitter and to a lesser extent Facebook as you know and I see a little Fs and Ts up there in the top right. I assume this means that I can take parts of the report and drop them into Twitter and Facebook and I see a LinkedIn link there as well?

Peter Graf: Yes, exactly. So first of all, it?s interesting to see that there are really conversations going on, on the right. People can rate these and you can look at things from a time perspective or most popular. You can always share comments and when you do, you are asked to use your credentials in one of those social websites to go and leave a comment.

So, for example, I can now login in Twitter and use my Twitter account here and sign in. At that point in time, I?m brought back into the application, now I?m logged in into the report and when I share something now, I?m actually putting something out there.

I don?t want to type in this is a test, but when I do, you are getting the question, if you want to tweet it at the same time as leave your comment on the report. And in this way, we get a lot of traffic, because these comments go out on Twitter and on the web into Facebook and people come back to the actual site.

The other beautiful element of the logging in is that you can really ensure that your voice is heard. So for example, this is our materiality matrix and it?s a way for us to have structured feedback from people that go to the report. You can see how over time materiality changed, so things became more important, things became less important and this is a real time feed.

So, I can actually go in, open this matrix and drag and drop points there according to what I think is important for me and for things that I think that are important for SAP. And when I go and save this, very interesting things happen, this data comes back to SAP and we can actually go and look at the navigated view and that?s what I can show you right now.

So, if I go to real time this is the aggregate of all the hundreds of people that went there and communicated to us what they deemed to be important and what not. And people are really making up their mind; there is a lot of ?Yes or No.? It?s pretty clear what?s in and what?s not so important and we like that, they are better — that?s a great feedback for us.

There is one more thing Tom that I would like to highlight, which is the impact we have now taken, not just our own operational impact, but really the impact we have on a greater scale. And we have done some estimates in terms of what is the impact of SAP through its customers on the world.

So, for example, we believe that our sustainable supply chain solution help about 800 million consumers live safer and healthier. In other words, the product safety capabilities that SAP brings to the table combined with the large amount of customers in the consumer space of SAP have delivered significant value to everybody and that?s how we are describing that.

These are estimates and we want people to comment to how we get to the number, because we explain it in detail, this is how we get to this number and we really would like more feedback from everybody in terms of how we measure that and how that could be improved.

So, if anyone has a comment, please leave it up here.

Tom Raftery: Cool, Peter that?s been fantastic. Thanks a million for that, thanks for coming on the show.

post

SAP Sustainability Report 3rd quarter updates

SAP Sustainability Report 2009 quarterly updates

I have posted here in the past on just how way ahead of the pack SAP’s 2009 Sustainability Report is, however having gone through it in detail when it came out, I didn’t revisit it much until the other day.

Why did I go back to visit the Sustainability Report again recently? Because I was on a call with SAP’s Chief Sustainability Officer, Peter Graf who was telling me about the updates to the report.

SAP's CSO, Peter Graf

SAP's CSO, Peter Graf

“Updates to a Sustainability Report?” I hear you say – yes, SAP are publishing quarterly updates on their Sustainability Report site – one of the advantages of having their report on a website, as opposed to a PDF, is the ability to update it regularly (another advantage is to be able to use website analytics software to see what aspects of the report are generating the most interest).

Anyway, I digress! While chatting to Peter on the call I realised that SAP have been populating the the updates, not just with data but also with SAP Sustainability news stories, many of which I had missed during the year! In case you have too – here’s a quick rundown of them:

  1. SAP was named as the highest ranking software company in the 2010 Dow Jones Sustainability Index – this is the fourth consecutive year SAP has been in the number one spot here.
  2. SAP Americas headquarters achieved a LEED Platinum certification – this is the highest rating given by the US Green Building Council (USGBC) for low impact buildings
  3. SAP released version 5.0 of its Carbon Impact OnDemand software. The latest version includes language support for more than 50 countries, automated data collection and strategies for energy and emissions reduction
  4. The Carbon Disclosure Project announced a new service – the CDP Reporter Service. This consists of an emissions reporting tool (a light version of SAP Carbon Impact OnDemand) to collate and prepare emissions data for disclosure and verification as well as an enhanced analytics tool (based on SAP software) “to maximise the value of CDP?s global climate change data set for benchmarking purposes.
  5. and finally

  6. SAP has published a version of their Sustainability Report in Spanish. According to Peter, Spanish was the foreign language most in demand by SAP’s customers and more languages are coming soon.

Some great news there – and another good reason to keep checking back on the SAP Sustainability Report!

Photo credits Tom Raftery

post

SAP’s latest Sustainability Report is teh awesome!

SAP's 2009 Sustainability Report using OAuth!

SAP released its 2009 Sustainability Report during the week and if last years Sustainability Report was good, this one is outta the park!

SAP released their first Sustainability Report in November 08 reporting on the 2007 year. It was a good initial effort (prepared in accordance with the GRI guidelines and achieving a ?C? level certification) delivered in your typical PDF format. The main innovation the first year was that there was a separate site for readers to leave feedback.

Then in May 2009 SAP released their 2008 Sustainability Report. This report achieved a B+ GRI rating and was far more interactive than the previous report (or any Sustainability Report I had previously seen). It allowed readers to interact with the data and showcased the interactive Sustainability Map which categorised core business processes related to sustainability and mapped them into distinct categories. Again SAP solicited feedback from users.

Now the 2009 Sustainability Report takes this to the next level. It:

  • achieved an A+ GRI rating by reporting on more sustainability GRI indicators and by adding new metrics, including Renewable Energy, Business Health and Culture Index, and Employee Satisfaction
  • includes the new edition of the Sustainability Map
  • establishes short- and long-term goals for many of SAPs metrics beyond carbon footprint
  • contains more embedded interactive dashboards leveraging data sourced from SAP Carbon Impact and SAP Business Objects Sustainability Performance Management
  • enables readers to comment on SAPs performance and solutions in the context of the report (no longer on a separate site) and
  • SAP will now produce quarterly updates on their carbon performance

There’s also the Materiality Matrix and the Create Your Own sections where you can try out different scenarios to see how they would affect SAP’s goals.

What do I love about this report?

  • I love how the two co-CEO’s went beyond simply putting their name to a letter at the start of the report (that’s so 2009!). They took the time out to record videos to introduce the Sustainability Report and talking about SAP’s commitment to sustainability.
  • I love the ability to leave comments on every page. The comment system allows you to login using your Twitter, LinkedIn, Yahoo, FaceBook, Google, or AOL credentials and uses OAuth for account verification. The geek in me just loves that (hence the screenshot above).
  • I love how the performance summary presents the data in stunningly simple to digest format. Clicking on the data here drills down into more detail on those numbers. The detail section is often highly interactive. For example in the carbon footprint section of the report you can see the carbon footprint by quantity, or by employee, by region or overall, by emission scope and clicking on a year gives a breakdown for that year specifically. Also, clicking on the printer icon allows you to print, while clicking on the Excel icon lets you download the data! and
  • I love how this report makes SAP’s sustainability data and their targets so transparent

Scott Bolick, SAP’s VP Sustainability Solutions, informed me that readership of SAP’s Sustainability report went from 3,500 for the 2007 PDF report to approx 30,000 readers for the online 2008 report. On top of that, many of SAP’s customers after looking at it, asked if they could purchase the technology to produce a similar report themselves! That’s a ringing endorsement right there.

It will be interesting to see what the readership of this report will be – you gotta suspect it will blow way past the 30,000 that last year’s report had.

[Disclosure – SAP are GreenMonk clients]