
SAP released its 2009 Sustainability Report during the week and if last years Sustainability Report was good, this one is outta the park!
SAP released their first Sustainability Report in November 08 reporting on the 2007 year. It was a good initial effort (prepared in accordance with the GRI guidelines and achieving a ?C? level certification) delivered in your typical PDF format. The main innovation the first year was that there was a separate site for readers to leave feedback.
Then in May 2009 SAP released their 2008 Sustainability Report. This report achieved a B+ GRI rating and was far more interactive than the previous report (or any Sustainability Report I had previously seen). It allowed readers to interact with the data and showcased the interactive Sustainability Map which categorised core business processes related to sustainability and mapped them into distinct categories. Again SAP solicited feedback from users.
Now the 2009 Sustainability Report takes this to the next level. It:
- achieved an A+ GRI rating by reporting on more sustainability GRI indicators and by adding new metrics, including Renewable Energy, Business Health and Culture Index, and Employee Satisfaction
- includes the new edition of the Sustainability Map
- establishes short- and long-term goals for many of SAPs metrics beyond carbon footprint
- contains more embedded interactive dashboards leveraging data sourced from SAP Carbon Impact and SAP Business Objects Sustainability Performance Management
- enables readers to comment on SAPs performance and solutions in the context of the report (no longer on a separate site) and
- SAP will now produce quarterly updates on their carbon performance
There’s also the Materiality Matrix and the Create Your Own sections where you can try out different scenarios to see how they would affect SAP’s goals.
What do I love about this report?
- I love how the two co-CEO’s went beyond simply putting their name to a letter at the start of the report (that’s so 2009!). They took the time out to record videos to introduce the Sustainability Report and talking about SAP’s commitment to sustainability.
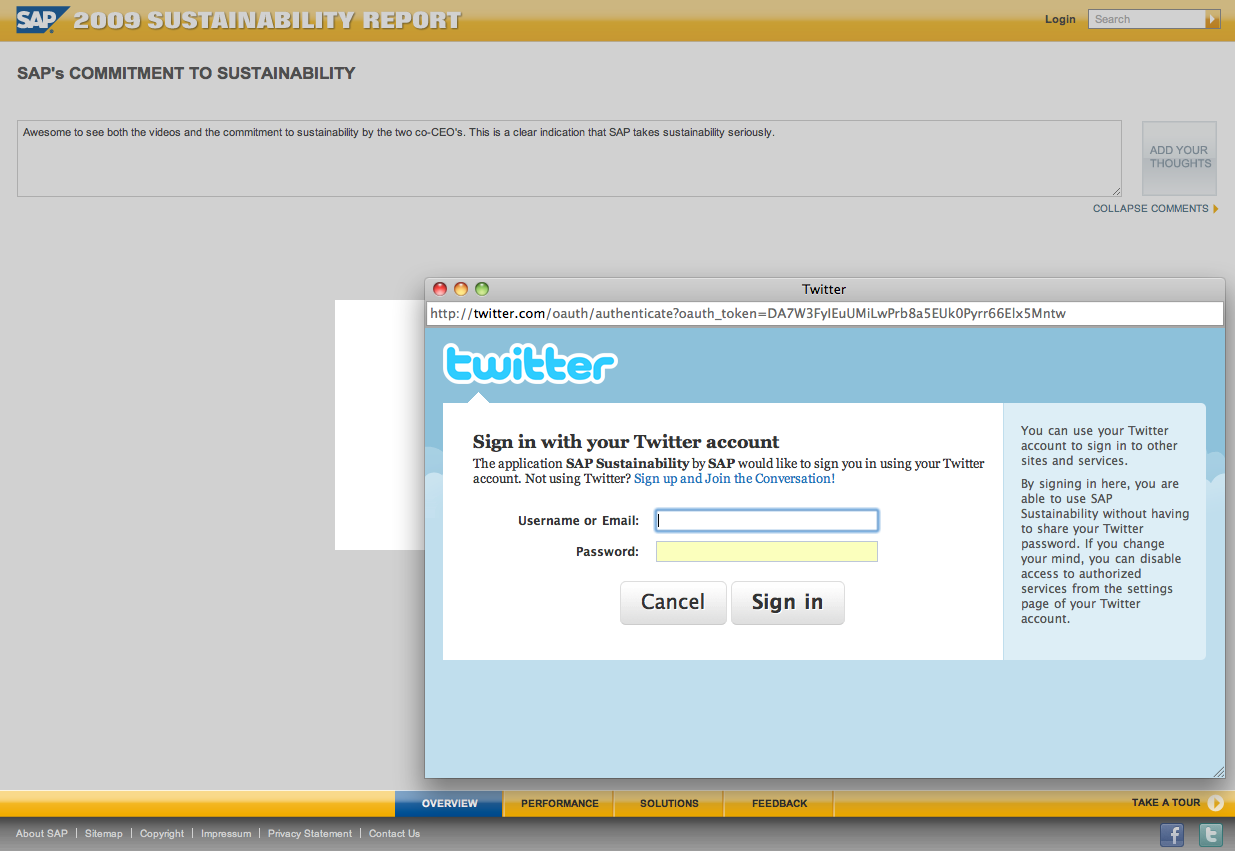
- I love the ability to leave comments on every page. The comment system allows you to login using your Twitter, LinkedIn, Yahoo, FaceBook, Google, or AOL credentials and uses OAuth for account verification. The geek in me just loves that (hence the screenshot above).
- I love how the performance summary presents the data in stunningly simple to digest format. Clicking on the data here drills down into more detail on those numbers. The detail section is often highly interactive. For example in the carbon footprint section of the report you can see the carbon footprint by quantity, or by employee, by region or overall, by emission scope and clicking on a year gives a breakdown for that year specifically. Also, clicking on the printer icon allows you to print, while clicking on the Excel icon lets you download the data! and
- I love how this report makes SAP’s sustainability data and their targets so transparent
Scott Bolick, SAP’s VP Sustainability Solutions, informed me that readership of SAP’s Sustainability report went from 3,500 for the 2007 PDF report to approx 30,000 readers for the online 2008 report. On top of that, many of SAP’s customers after looking at it, asked if they could purchase the technology to produce a similar report themselves! That’s a ringing endorsement right there.
It will be interesting to see what the readership of this report will be – you gotta suspect it will blow way past the 30,000 that last year’s report had.
[Disclosure – SAP are GreenMonk clients]
[…] As previously reported here, the 2009 SAP Sustainability Report is superb. […]