post

Flexible Power Alliance develops open source software and standard for smart grid demand management

We have been talking here on GreenMonk about energy demand management since early 2008, and our take on it has always been that for demand management to work, it will need to be automated. Unfortunately, finding a decent automated demand management solution has proven elusive. In part, the recent rise of the Internet of Things technologies has helped spur more interest and developments in this area.

Last week, for example, we attended the European Utility Week in Vienna, and amongst the many fascinating stands that were there, I came across the Flexible Power Alliance on CGI‘s stand.

The Flexible Power Alliance is an open source software alliance comprised of software companies (CGI, and Accenture), Utilities (Alliander and Stedin), and research organisations (such as TNO). This Alliance has developed a standard called FAN which is a communication layer between devices and energy services, and open source software called PowerMatcher, which helps to match the supply and demand of electricity on a grid.

The software developed with Java and OSGI, is Apache 2.0 licensed, and is available to download (or fork) on Github.

And in the video above, we talk to Alliander DevOps Consultant Alexander Krstulovic, and he demonstrates the software in action on a small microgrid. The software turns up and down the consumption of a bank of LED lights, and changes the price of electricity depending on the realtime availability of energy on the virtual market created by the software.

It is worth pointing out that Alliander has trialled this software in the real world, and are now in the process of commercialising it.

post

Apple launches ResearchKit – secure, private, open source medical research

ResearchKit

Apple announced a new initiative at its Spring Forward event yesterday – ResearchKit.

What is ResearchKit? Apple’s SVP of Operations, Jeff Williams, described it as a framework for medical researchers to create and deploy mobile apps which collect and share medical data from phone users (with their permission), and share it with the researchers.

Why is this important? Previously it has proven difficult for research organisations to secure volunteers for research studies, and the data collected from such studies is often collected, at best, quarterly.

With this program, Apple hopes to help researchers more easily attract volunteers, and collect their information far more frequently (up to once a second), yielding far richer data.

The platform itself launches next month, but already there are 5 apps available, targeting Parkinson’s, diabetes, heart disease, asthma, and breast cancer. These apps have been developed by medical research organisations, in conjunction with Apple.

The success of this approach can be seen already in this tweet:

I downloaded mPower, the app for Parkinson’s to try it out, but for now, they are only signing up people who are based in the US.

As well as capturing data for the researchers, mPower also presents valuable information to the user, tracking gait and tremor, and seeing if they improve over time, when combined with increased exercise. So the app is a win both for the research organisations, and for the users too.

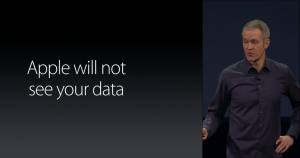
Apple Does Not See Your Data

Apple went to great pains to stress that the user is in complete control over who gets to see the data. And Apple themselves doesn’t ever get to see your data.

This is obviously a direct shot at Google, and its advertising platform’s need to see your data. Expect to hear this mantra repeated more and more by Apple in future launches.

This focus on privacy, along with Apple’s aggressive stance on fixing security holes, and defaulting to encryption on its devices, is becoming a clear differentiator between Apple and Android (and let’s face it, in mobile, this is a two horse race, for now).

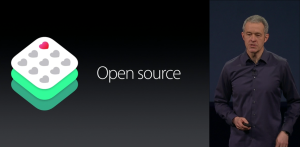
ResearchKit Open Source

Finally, Williams concluded the launch by saying Apple wants ResearchKit on as many devices as possible. Consequently, Apple are going to make ResearchKit open source. It remains to see which open source license they will opt for.

But, open sourcing ResearckKit is a very important step, as it lends transparency to the privacy and security which Apple say is built-in, as well as validating Apple’s claim that they don’t see your data.

And it also opens ResearchKit up to other mobile platforms to use (Android, Windows, Blackberry), vastly increasing the potential pool of participants for medical research.

We have documented here on GreenMonk numerous times how Big Data, and analysis tools are revolutionising health care.

Now we are seeing mobile getting in on the action too. And how.

post

Technology for Good – episode thirty four with Salesforce’s John Tascheck

Welcome to episode thirty four of the Technology for Good hangout. In this week’s episode our guest was SalesForce SVP of Strategy, John Taschek. John and I are both longtime members of the Enterprise Irregulars, but this was the first time John and I had had a conversation outside of email!

Some of the more fascinating stories we looked at on the show, included a very successful Kickstarter campaign for a small router which can completely anonymise your internet activity, Lockheed Martin announcing that they’ve made a breakthrough on nuclear fusion technology, and Satya Nadella’s response to his gaffe last week about women seeking a raise.

Here is the full list of stories that we covered in this week’s show:


Climate

Energy

Hardware

Internet of Things

Wearables

Mobility

Comms

Privacy

Open Source

Sustainability

post

Technology for Good – episode twenty seven with SalesForce’s Peter Coffee

Welcome to episode twenty seven of the Technology for Good hangout. In this week’s episode we had SalesForce‘s Vice President of Strategic Research, Peter Coffee as the guest on our show.

We have met a talked with Peter a couple of times, and have always been impressed by the breadth of his knowledge, as well as his thoughts on things environmental. Also having seen that, when asked to come up with a challenge for the Cap Gemini Super Techies Show, he went with…

Present a technology vision for taking an existing bicycle manufacturer and retailer to the next level as a transportation option


… we were very keen to have Peter as a guest on the show.

We covered some fascinating stories on the show, including the White House’s plan to use technology to unleash data to help America’s agriculture sector, how Facebook’s Internet.org is helping people get online in Zambia, and a new initiative to help parents do simple science experiments at home with their kids.

Here is the full list of stories that we covered in this week’s show:

Climate


Transport

Apps/Mobile

Apps/Cloud

Crowdsourcing

Security

Open technologies

Moore’s Law

Diversity

Education

post

Technology for Good – episode twenty with Sam Johnston

Welcome to episode twenty of the Technology for Good hangout. In this week’s episode we had Sam Johnston Director, Cloud & IT Services at Equinix, as a guest on the show. Sam is an old friend, so we had a lot of fun discussing this week’s crop of stories. This week was relatively quiet on the technology front – whether that’s a hangover from last week’s Sapphirenow and Apple WWDC, or the World Cup, I’m not sure, but still we found plenty to talk about; especially on the health, IoT and wearables fronts.

Here are the stories that we discussed in this week’s show:

Climate

Renewables

Cloud

Open

Wearables

Health

Internet of Things (IoT)

Apps

I.T.

Misc

post

Can we hack open source cloud platforms to help reduce emissions – my Cloudstack keynote talk

This is a video of me giving the opening keynote at the Cloudstack Collaboration conference in Las Vegas last December. The title of my talk was Can we hack open source cloud platforms to help reduce emissions and the slides are available on SlideShare here if you want to download them, or follow along.

Be warned that I do drop the occasional f-bomb in the video, so you might want to listen to this with headphones on if there are people nearby with sensitive ears 😉

And I have a transcription of the talk below:

Good morning everyone! I’m absolutely astounded of the turn out at this time on a Saturday morning. I said to Joe yesterday evening, I think it was, that I reckoned it would be just me and the AV guy here this morning but now you’ve turned up. That’s a fantastic, phenomenal. Thank you so much. I hope we make it worth your while. My talk, Joe mentioned I’m from RedMonk. RedMonk is an analyst firm. I work on the green side of a house, so I’m all about energy and sustainability. I’m talking about using open source cloud platforms to measure and report energy and emissions from cloud computing.

A couple of quick words about myself first. As I said, I lead analyst energy and sustainability with RedMonk. You can see there, my blog is on greenmonk.net. My Twitter account is there. My email address is there. My phone number is there. Please don’t call me now. I’m using the phone as my slide forwarder. SlideShare, I’ll have this talk up on SlideShare shortly.

Also, a couple of companies I’ve worked with. I worked to the company called “Zenith Solutions” back in the mid-’90s. It’s a company that I set up in Ireland. As we called it at the time, it was a web applications company. Web applications at that time morphed into SaaS, “Software as a Service.” Back in the mid to late 90s, I was setting up these Software as a Service Company, so I knew a little bit about cloud. Then Chip Electronics was an ERP company, but it was a Software as a Service delivered ERP. That was around 2002. CIX, the other company that’s there.

CIX is a data center company that I founded in 2006 in Ireland. I kind of know a little bit about cloud both from the software and from the hardware side. I’ve setup a data center and I’ve also setup software companies dealing with cloud stuff. Like I say, a little bit of the background in it. I know what I’m talking about, not that much, but I’ll bluff it.

This is a report. It’s a graph from a report that came out just a couple of weeks ago. It’s from WSP Environmental and the NRDC. Basically, what they’re saying in this report, it’s a long report, the link is at the bottom there. As I say, this talk will be on SlideShare, so you can link on the link in SlideShare and get straight to the report. What the report is saying basically is that cloud computing is green. There have been a couple of reports like that which have said that. Most of them have been tainted before now. There was one that Microsoft helped put out, obviously Microsoft have got a foot in the game so you kind of wonder about that one. There was another one that was put out by the Carbon Disclosure Project, but it was paid for by AT&T. That was highly suspect. This one’s actually quite good. They’ve done quite a bit of work on it. You actually have to take it seriously unlike the previous two and it does seem to suggest that cloud computing is green, and that’s good.

Previous ones, as I say were suspect. The issue with this that I have and it’s a small issue, but this issue or this report is a really good report but it’s speculative. It says cloud computing should be green. Probably, is green. Maybe green, but they’re not working on any hard data and that’s where we’ve got a serious problem with cloud computing.

Taking a step sideways for a second, this is a guy called Garret Fitzgerald. Garret Fitzgerald was a politician in Ireland in the ’80s and ’90s. He died last year. A very unusual politician because he was one of the very few politicians who actually have integrity, very well-know for his integrity. He was also not just known for his integrity, but he was an academic. He came from an academic background. He worked in Trinity College Dublin as a statistician, so he was a data guy.

Now, in the mid-’40s, the Aeroflot, Russian Airline Company, it was at ’47 I think or ’49, for the first time, published their flight schedule. They’d never done this before. They published their entire flight schedule, their global flight schedule. Garret Fitzgerald looked at this, analyzed it and figured out he could know by going through this in detail, he could figure out the exact size of the Aeroflot fleet down to the number and types of planes they had in their fleet, and this was a state secret.

This was nothing that had ever been published before, but by analyzing their schedules, he worked it out and he published it, and as a result, the KGB had a file on him because they thought he was a spy.

Two things about this slide, first is you do a creative common search on Flickr for KGB, and this is one of the images you’ll find. It’s got a KGB logo and his got a cat, so you got two memes right there. A, the internet is fucking awesome and B, well the main thing to take away from this is that there is no such thing as security by obscurity. Hiding your data will not work. Somebody will figure the damn thing out. That’s where we’ve got a big issue with cloud computing because there is absolutely no transparency in cloud computing.

This is a blog post that I’ve put up. If you follow greenmonk, which is where I blog at greenmonk.net, you’ll find there’s a ton of blog posts on this very topic, the lack of transparency in cloud computing. I have done blog posts about it. I’ve given webinars about it. I’ve hassled people about in the space. The SalesForces, the Rackspaces, I’ve hassled them all.

Recently, the New York Times picked up the story. I’m not going to say it has anything to do with me, they actually run a really good story. Again, the link is at the bottom there. One of the things that they have mentioned in that story — please do go and click on that link and read that article. It’s a really good article.

One of the things they have mentioned in that article is a McKinsey study. In that McKinsey study, they say that globally for data centers, somewhere between six percent and 12%, depending on the data center, somewhere between six percent and 12% of the power going into the servers in the data centers is used for computing. The other 88% is used for elasticity. It’s used to keep them going in case there’s a burst of activity, so 88%, if we take a conservative look, 88% of the power going into those servers is the E in Elastic Cloud, horrific waste.

Do you think that people’s often mistake in this area, is people often equate or conflate energy with emissions, and that’s a mistake. They are not the same thing, not at all. The reason they are not is because if you take the example of — for example, the Facebook Data Center in Prineville, Oregon, a fabulous data center. They’ve opened sourced it, the whole open compute project. They’ve opened sourced the entire building on this data center.

The data center, if you know anything about data center statistics, there’s a metric for data centers called the PUE. The PUE is the Power Usage Efficiency. The closer you are to one, the more efficient you are. Facebook’s data center comes in around 1.07 or 1.08, depending on time of the year on usage and stuff like that, but it’s in and around 1.08. It’s almost unheard of efficiency, 1.5 is kind of average, 2.0 is older data centers, and 3.0 is dirty. This is 1.07 or 1.08.

Unfortunately, although it’s extremely efficient — this is Facebook’s numbers here, 1.08 plus their computing power has declined by 38%, but the problem with that is, this data center is powered by company called PacifiCorp. PacifiCorp are the local utility in Oregon, in Prineville where this is based.

PacifiCorp mines 9.6 million tons of coal every year. It doesn’t matter how efficient your data center is. If you’re mining 9.6 million tons of coal to run your Facebook data center, it’s not green. I don’t care how efficient it is. It’s not a green.

It’s not just Facebook, it’s not just Prineville, Dublin, in Ireland, I’m Irish — guilty. Dublin has become a center for cloud computing as well. All of the big companies are there. Microsoft is there, they got their big Live servers there, Google are there, Amazon are there, they’ve all got data centers there. Ireland, unfortunately, gets 84% of its electricity from fossil fuels. Again that’s not very green. It’s not just Ireland, the U.K. is another big center for cloud computing in London, and again, over 90% of the electricity in the U.K. comes from fossil fuels. This is really, really bad stuff.

Now, if you look at this chart, this is why I say that the PUE which is in the middle column here, isn’t a whole lot important because as I said, if you look at the bottom row there, it’s got a PUE of three I said that was really dirty. Top row, PUE of 1.5 is at the average, middle row PUE of 1.2 kind of in the middle, but if you look at the power source coming into these putitive data centers, so your typical one, the top line, typical one has a supply carbon intensity of half a kilo per kilowatt hour, that’s pretty standard. If that has a data center PUE of 1.5, then you’re getting simple math, 0.75 a kilo per kilowatt hour. If you have a good PUE of 1.2, but with coal fired power coming at 0.8 of a kilo per kilowatt hour, you’re now looking at IT carbon intensity of 0.96.

Look at the bottom line, a PUE of three, one of the dirtiest data centers you can get, but it’s powered almost all by renewables, it’s not all because it’s got a 0.2 kilograms and a PUE of three, it still comes in at an IT carbon intensity of 0.6, which is far better than the 1.2 PUE or the 1.5 on typical. The take home message from this slide is that it’s the source of the electricity is what determines the carbon footprint of your cloud, not the efficiency of your data center.

Now, if we look at some of the cloud providers that are out there today and if I left anyone out, apologies, I just stuck these logos up based on the availability of the logos. It’s not an any kind of research or anything but that.

If we look at the cloud providers that are out there, these ones are semi-clean. If we look, for instance, at Rackspace, they have a data center in the U.K. which they claim as 100% powered by renewables. Now, they haven’t given us a whole load of data, but let’s just take the word on it. If you go with Rackspace and you go with their U.K. data center it’s supposedly 100% green, we’ll see. Google, Google have done a really good job on investing in renewables. They spent almost a billion dollars on buying into Windfarms, power purchase agreements with big Windfarms the whole thing. They’ve gone out on a serious limb, in terms of renewables. I’m pretty positive about them. They’re still doing a lot of the old buying carbon credits and stuff like that, but they got old data centers that they need to top up with carbon credits.

Green Cloud is an interesting one. Green Cloud are company that bill themselves as an AWS replacements, dropping AWS replacement and why they are cool is because — pun intended.

They’re cool because they’re based in Iceland. The electricity grid on Iceland is 100% renewable, its 30% geothermal, 70% hydro. The entire grid is a 100% renewable energy and it’s baseload energy and what’s even more interesting about it, as a grid is, there are 300,000 people living in Iceland, that’s it — 320,000. They’ve realized that they got this energy infrastructure and way more energy than they can every use, so they decided to invite people who need lots of energy. I’m not talking about data centers. I’m talking about Aluminium Smelting Plants.

So, they got Aluminium Smelting Plants in Iceland. These guys take up 500 megawatts at a time. A big data center is 50 megawatts. They’re 10 times the biggest data center you’ve ever come across, in terms of the power utilization. They are on all day, everyday, 24/7, 365, it’s a flat line. Any electricity grid you look at, if you look at the demand curve, it goes like that everyday. Peaks in the morning, when people get up, peaks in the late afternoon when people come home from work. Iceland, the flat line all the way. It is the only country whose electricity grid is just flat all the time. It’s always on. It’s always flat. There is no movement in it or whatsoever. It is the most reliable electricity grid in the world. It’s also one of the cheapest. It’s also 100% green.

If you are looking to site a data center, I recommend Iceland. Greenqloud are based there, and as I say, their Cloud is obviously 100% green. We’ll come back to them.

Amazon put out this report earlier this year where they said that, “Both their Oregon and their GovCloud were a 100% carbon free”. That sounds nice. Unfortunately, when you actually ask them about it, so this is Bruce Durling, a guy I know in the U.K. He asked Jeff — it’s a story for this 100% green claim that it’s just going out. Jeff says, “You know, we don’t share any details about it, but I’m happy to hear you like it.” Bruce comes back and says, “How can we verify if this is true, there are lots of different ways to claim zero carbon.” And then you’ll just hear cricket chirps, nothing, no data, and no response. Bruce isn’t the only guy, several people took Jeff up on this asked him, “What’s the story with your claim for 100% green in these two clouds? “Nothing, nothing.” And it’s appalling that they are not talking because this is the kind of stuff we need to know. There is no data coming at of a lot of the cloud manufacturer or cloud providers.

Looking again at the cloud providers I’ve mentioned, if we look at some of the ones who are providing some data. If we look, for example, at SAP, SAP has got a really good sustainability report that they release every year. In fact they release quarterly even better. Unfortunately, the only data, they give us about their Cloud, is that eight percent of their carbon emissions are from their data centers. That’s as granular as it gets. We know no more about their carbon emissions, about their Cloud than that.

If we look at Salesforce, Salesforce go a little further. Salesforce have got this carbon calculator under site which is interesting. If you choose as I did in this screen shot, you can see I chose — I was based in Europe which I am. I decided to say I was in a company of 10,000 plus, and I decided to say, “Look, I’m going from on-premise to Salesforce. So, they tell me, “Fantastic! You’re going from on-premise, 10,000 plus based from Europe you’re going to save 86% and 178 tons of carbon by moving to Salesforce, but of course that’s complete horse shit because Europe is not homogenous.

If I’m based in France, 80% of the energy in France is nuclear. If I’m based in Spain, which I am, 40% of the energy in the Spanish grid comes from renewables. There is no way that if I move my on-premise from France or Spain to Salesforce that I’m saving 178 tons of coal per annum. In fact, if I move to Salesforce, my carbon emissions are going to go up not down because Salesforce’s data centers are in the U.S. which is 45% coal or they’re in Singapore. Singapore is — if memory serves 93% fossil fuel so there is no way moving to Salesforce from a lot of the European countries is a step on the right direction in terms of green.

The other thing that they have — you can click on the link at the bottom of this as well on the Salesforce site. This is where they have your daily carbon savings. There are two problems with this, the first is — this screen shot was a couple of days ago and you could see they’re talking about the 13th of September is the most recent date, so it’s two months or more out-of-date. The second is they’re talking about carbon savings, which is bullshit made-up number. What they should be talking about is actual carbon emissions because they can just make up the carbon savings because it’s basing where you’re from. Like I say if I’m in Spain and my carbon savings are at a zero going to Salesforce. They should be talking about emissions not carbon savings of completely the wrong metric.

I talked about Greenqloud. Greenqloud, have this on their site which is nice. You log into Greenqloud — over the righthand side is part of your dashboard, you get your carbon figures. They are as well, and this is a conversation I’m having with them at the moment, they are also talking about the CO2 savings, they’re not talking about actual emissions. There are emissions obviously, if you’re working with Greenqloud, their CO2 footprint is negligible because it’s Icelandic, but there is that carbon expended between your laptop or your desktop and going to them. There is carbon put out there but it’s negligible compared to mostly of the other providers. The difficulty with this, as they say, is they’re talking about CO2 savings not CO2 emissions. I’m hoping to get them to change that.

Why don’t the Cloud providers provide this data? There are number of reasons. I’m speculating here. I don’t know. I’ve asked them, they’ve all said different reasons. One of them I’m going to think is competitive intelligence. They don’t want people to know what their infrastructure is. They don’t want people to do the Garret Fitzgerald and reverse engineer, to find out what it is they’re actually using to power their facilities. Another is maybe they don’t actually want people to know how much CO2 they’re pushing out. It’s not a happy story.

The other is, in fairness, there’s a lack of standards out there about cloud companies reporting emissions because how do you report emissions around cloud computing? Do you do it at CO2 per flop? What’s the metric? We don’t know, no one is doing it yet so we don’t know.

Peter Drucker, the management guru, is famous for saying, “If you can’t measure it, you can’t manage it.” That holds true. That does hold true for everything, and particularly in this space.

I’m going to go through a quick recap of 2012 and this is not going to be pleasant. This is an image taken from the U.S. Drought Monitor in September but it’s even more so now. So far, U.S. agriculture has loss $12 billion just in Q3 because of drought. It’s not just drought, there’s been massive wildfires globally, not just in the U.S. There’s been massive floodings everywhere, not just the floodings, but also a new report came out in the last week, and again the link is at the bottom, which says that, “Sea level rise globally is actually 60% higher than had been previously calculated.” They had thought sea levels were rising two millimeters per annum. It turns out sea levels are actually rising 3.2 millimeters per annum.

We have had more than 2000 heat records in June alone of this year in the U.S. alone, the sea ice — I got a chart here, you can look it up afterwards. I’ve got another chart here you can look it up afterwards, and I got an image here. It’s hard to see, but that’s the polar ice cap in September 13th when it was at its minimum.

The orange line outside that is the 30-year average at that time for the sea ice extent. It’s almost 50% less than what it should have been at that time. It’s scary. It’s scary stuff because when we lose the arctic and we’ve lost 50% of it this year, when we lose the arctic, you got a feedback mechanism because when you don’t have the ice to reflect the heat, you’ll got the water taking in the heat, and it gets hotter and it’s a feedback mechanism so the ice underneath melts as well, so you no longer have multi-year ice.

You got methane emissions, that’s literally methane coming from underneath the ice from organisms that had been frozen, but because everything heated up a little bit. They started producing methane. Now, another report out in the last week in the UNDP says, “The thawing of the permafrost is going to cause us enormous problems and it hasn’t been taken into account previously in any of the climate models.” None of the IPCC reports, up until now, have taken permafrost thawing into account because they think it was going to be significant. Suddenly, they’re realizing that the thawing of the permafrost is decades ahead of where they thought it would be. This is serious stuff because this could be 40% of the global carbon emissions soon, not good. It’s a big feedback mechanism again.

So okay, the Cloud. The hell is that going to do with cloud? I get it. Cloud isn’t responsible for all these emissions. I know that, but it’s responsible for some of them, at least two percent of the global carbon emission is coming from IT and that’s a 2006 Gartner figure(ph). So, it’s likely, significantly higher at this point.

What’s that going to do with open source? Why are we here? Well, I got to think that we’ve got this open source cloud platforms out there. There are a significant number of developers in the room. I think it’s entirely possible that people in this room could start writing patches for the open source cloud platforms that are there, so that the Cloud providers no longer have an excuse to say, “Oh, we can’t do it because it’s not in the software.”

If you guys start writing the software for them, start doing the energy emissions, reporting, and measurement software writing those patches for the open source global platforms. Then suddenly, it gets in to the core. It starts being deployed back out to the companies that are using these platforms.

This is the company called AMEE. Interestingly they’re a U.K. start-up, not really a start-up, they’re around four years now, but they named the company AMEE as the “Avoiding Mass Extinction Engine.” They don’t boast about that, but that’s where they got the name. They are an open source platform for carbon calculation. They’ve got open APIs. If you guys want to do this stuff, work with the AMEE open APIs because they’ve got all the data.

Then, as I say, it gets thrown back out to the client companies of the open source cloud platforms and then we’ve get serious traction. This is what we need to have happen. By the way, there’s a company called Mastodon C. I mentioned AMEE already. There’s another company called Mastodon C out there, who has a dashboard already in place, showing us the carbon emissions of the various cloud providers. It’s not great. They’re guessing it because the cloud providers aren’t reporting it. They’re guessing it based on the location of the cloud companies and utility companies who provide them with their energy but it’s better than nothing.

One other thing I should mention and I don’t want to be totally negative, but this should scare the fuck out of everyone in this room. PricewaterhouseCoopers, not known as being green, agitators, activists, there are the largest of the big four accounting companies. They came out with this report two weeks ago. It’s their carbon report. They come out with it annually. This report tells us that between the years 2000 and 2011 globally, our carbon emissions went down by 0.8% every year. That’s good, 0.8% reduction carbon emissions year on year.

The trouble is we’ve decided we want to keep our global warming figures. We want you to cap the warming at two degrees centigrade. Beyond that, it starts to get very hairy. The temperature has already gone up 0.8 of a degree centigrade, so we’ve got 1.2 degrees left.

According to PwC, the only way to keep this at two degrees is to reduce our carbon emissions not by 0.8%, as we’ve been doing, but to reduce our carbon emissions 5.1% every year between now and 2050. Six times the carbon reductions we’ve been doing for the last 11 years, every year for the next 38 years. So, sorry to be on a bit of a downer, but I have some good news.

This is Jim Hagemann Snabe. Jim is the co-CEO of SAP. I had a conversation with him in Madrid last week about this very topic and about… they are a cloud provider, I was asking him, “Why the hell aren’t you talking? Why aren’t you giving us your numbers? It wasn’t something he was aware of, it wasn’t something he had thought about, and Jim is actually a good guy. He’s actually a sustainability guy. Anytime you hear him talk, in the first three, four minutes of his talk, any talk he gives, he’ll bring up sustainability. Maybe sideways, he’ll talk about resource constraints or something, but he’s always thinking about this. When I brought this up with him, he was blown away because it hadn’t occurred to him at all and he said, “Tom you’re absolutely right, this is a space I want SAP to lead in.” Hopefully, something will come out of that, but it’s not just that.

This is Robert Jenkins. Robert is the CEO of CloudSigma, a Swiss-based company who are a Cloud Company. I’ve had conversations with him about this as well, and he is talking again about doing this also, about opening and being transparent about their emissions, so we’re getting some traction now in the space. Finally, Greenqloud, Greenqloud’s CEO is a guy called Eiki and I’m not going to try to pronounce his surname because it’s Icelandic and it’s just completely unpronounceable. Eiki has given me permission here today, to announce on behalf of Greenqloud that Greenqloud, because they are a CloudStack customer or user, and they have this energy on emissions stuff already built-in.

In Q2 of next year, they’re going to contribute their code back into CloudStack. So, for me, I think that’s a serious win because then it gets distributed back out. For me, that was a highlight of my last couple of week’s work, just getting Eiki to agree to in Q2 next year contributing that back into CloudStack.

So, that’s it. That’s me. Adding emissions, metrics and reporting to cloud computing will help reduce emissions. That’s it.

post

Can we hack open source #cloud platforms to help reduce emissions?

RedMonk runs two conferences a year – Monki Gras in London in late January/early February and Monktoberfest in Portland, Maine in early October.

At this year’s Monktoberfest I gave a talk titled “Can we hack open source #cloud platforms to help reduce emissions?” to an audience which consisted almost entirely of developers and the feedback I received was consistently positive. The slides for the talk are above and I’ll post the video as soon as it is available, along with a transcription.

My presentation was fairly straightforward – it was a call to action. I first outlined the problem – most cloud computing companies are not publishing data around their energy or (more importantly) their emissions. Those that are, are not publishing it in enough detail, or are publishing the wrong data (carbon saved, as opposed to carbon emitted). I also pointed out that energy use is not a proxy for emissions – the amount of emissions the important metric to track.

Why don’t cloud computing companies disclose their emissions? It is probably a combination of not wanting to give away competitive intelligence, not wanting to be viewed as a polluter, and there being no agreed reporting standards around this area.

Then I pointed out a quick recap of the year 2012 to-date with all of the wildfires, floods, droughts, temperature records, and unprecedented ice loss in the arctic. I know these aren’t solely caused by cloud computing, but it is a significant contributor (estimates from Gartner in 2007 put the amount at 2% of global emissions – and that number is highly likely to have increased since then).

The solution – I proposed a fairly straightforward solution. Hack the currently available open source cloud platforms (Eucalyptus, CloudStack and OpenStack), write emissions measurement and reporting patches. Get the patches accepted back into the core so that when the next update of the software is pushed out, the companies using the three platforms will at a stroke, have energy and reporting capabilities. At that point customer demand should ensure that they make this info public (or at least available to their customers).

I concluded by noting that adding emissions metrics and reporting to cloud computing platforms will reduce emissions – and then asking the audience “Ok, so who’s up for it?”

During the Q&A, Andy Piper rightly pointed out that it would have been appropriate for me to mention the Cleanweb Manifesto in my talk and he was absolutely correct. Next time I give the talk I will point it out and urge people to sign it.

post

Use open source platforms to find cloud computing’s energy and emissions footprint

Dials

Regular GreenMonk readers will be very aware that I am deeply skeptical about claims that Cloud Computing is Green (or even energy efficient). And that I talk about the significant carbon, water and biodiversity effects cloud computing can have.

One of the biggest issues with any claims of Cloud Computing being energy efficient, or Green, is the lack of transparency from the Cloud Computing providers. None Almost none of them are publishing any data around the energy consumption, or emissions of their Cloud infrastructure (article updated from “None of them” to “Almost none of them…” after comments from Memset and Greenqloud in the comments section below). Without data to back them up, any claims of Cloud computing being efficient are worthless.

Last week, while at the RackSpace EMEA Analyst day, we were given a potted history of OpenStack, RackSpace’s Cloud Computing platform. OpenStack was jointly developed by NASA and RackSpace and they open-sourced it with an Apache License in July 2010.

Anyone can download OpenStack and use it to create and host Cloud Computing solutions. Prominent OpenStack users include NASA, RackSpace (not surprisingly), AT&T, Deutsche Telecom, HP and IBM.

What has this got to do with Cloud Computing and energy efficiency I hear you ask?

Well, it occurred to me, during the analyst day, that because OpenStack is open source, anyone can fork it and write a version with built-in energy and emissions reporting. What would be really cool is, if this functionality, having been written, became a part of the core distribution – then anyone deploying OpenStack, would have this functionality by default.

And, OpenStack isn’t the only open source Cloud platform – there are two others that I’m aware of – Citrix’s CloudStack and Eucalyptus. Having the software written for one open-source platform, should allow reasonably easy porting to the other two.

Of course, with the software written as open-source, there could be constant improvement of it. And as part of one of the cloud platforms, it should achieve widespread distribution quickly.

Having energy and emissions information available, will also allow inefficiencies in Cloud infrastructure to be quickly identified and fixed.

So, the next step is to get someone to write the software – anyone up for it?

Or, what are the chances of getting someone like HP, IBM, RackSpace, or even NASA to sponsor a hackathon whose aim is to develop such software?

Photo Credit Jeremy Burgin

post

FaceBook open sources building an energy efficient data center

FaceBook's new custom-built Prineville Data Centre

Back in 2006 I was the co-founder of a Data Centre in Cork called Cork Internet eXchange. We decided, when building it out, that we would design and build it as a hyper energy-efficient data centre. At the time, I was also heavily involved in social media, so I had the crazy idea, well, if we are building out this data centre to be extremely energy-efficient, why not open source it? So we did.

We used blogs, flickr and video to show everything from the arrival of the builders on-site to dig out the foundations, right through to the installation of customer kit and beyond. This was a first. As far as I know, no-one had done this before and to be honest, as far as I know, no-one since has replicated it. Until today.

Today, Facebook is lifting the lid on its new custom-built data centre in Prineville, Oregon.

Not only are they announcing the bringing online of their new data centre, but they are open sourcing its design, specifications and even telling people who their suppliers were, so anyone (with enough capital) can approach the same suppliers and replicate the data centre.

Facebook are calling this the OpenCompute project and they have released a fact sheet [PDF] with details on their new data center and server design.

I received a pre-briefing from Facebook yesterday where they explained the innovations which went into making their data centre so efficient and boy, have they gone to town on it.

Data centre infrastructure
On the data centre infrastructure side of things, building the facility in Prineville, Oregon (a high desert area of Oregon, 3,200 ft above sea level with mild temperatures) will mean they will be able to take advantage of a lot of free cooling. Where they can’t use free cooling, they will utilise evaporative cooling, to cool the air circulating in the data centre room. This means they won’t have any chillers on-site, which will be a significant saving in capital costs, in maintenance and in energy consumption. And in the winter, they plan to take the return warm air from the servers and use it to heat their offices!

By moving from centralised UPS plants to 48V localised UPS’s serving 6 racks (around 180 Facebook servers), Facebook were able to re-design the electricity supply system, doing away with some of the conversion processes and creating a unique 480V distribution system which provides 277V directly to each server, resulting in more efficient power usage. This system reduces power losses going in the utility to server chain, from an industry average 11-17% down to Prineville’s 2%.

Finally, Facebook have significantly increased the operating temperature of the data center to 80.6F (27C) – which is the upper limit of the ASHRAE standards. They also confided that in their next data centre, currently being constructed in North Carolina, they expect to run it at 85F – this will save enormously on the costs of cooling. And they claim that the reduction in the number of parts in the data center means they go from 99.999% uptime, to 99.9999% uptime.

New Server design
Facebook also designed custom servers for their data centres. The servers contain no paint, logos, stickers bezels or front panel. They are designed to be bare bones (using 22% fewer materials than a typical 1U server) and for ease of serviceability (snap-together parts instead of screws).

The servers are 1.5U tall to allow for larger heat sinks and larger (slower turning and consequently more efficient) 60mm fans. These fans only take 2-4% of the energy of the server, compared to 10-20% for typical servers. The heat sinks are all spread at the back of the mother board so none of them will be receiving pre-heated air from another heat sink, reducing the work required of the fans.

The server power supply accepts both 277V AC power from the electrical distribution system and 44V DC from the UPS in the event of a utility power failure. These power supplies have a peak efficiency of 94.5% (compared to a more typical 90% for standard PSU’s) and they connect directly to the motherboard, simplifying the design and reducing airflow impedance.

Open Compute
Facebook relied heavily on open source in creating their site. Now, they say, they want to make sure the next generation of innovators don’t have to go through the same pain as Facebook in building out efficient data centre infrastructure. Consequently, Facebook is releasing all of the specification documentation which it gave to its suppliers for this project.

Some of the schematics and board layouts for the servers belong to the suppliers so they are not currently being published, though Facebook did say they are working with their suppliers to see if they will release them (or portions of them) but they haven’t reached agreement with the suppliers on this just yet.

Asked directly about their motivations for launching Open Compute Facebook’s Jay Park came up with this classic reply

… it would almost seem silly to do all this work and just keep it closed

Asking Facebook to unfriend coal
Greenpeace started a campaign to pressure Facebook into using more renewable energy resources due to the fact that Pacific Power, the energy supplier Facebook will be using for its Prineville data center produces almost 60% of its electricity from burning coal.

Greenpeace being Greenpeace, created a very viral campaign, using the Facebook site itself, and the usual cadre of humurous videos etc., to apply pressure on Facebook to thinking of sourcing its electricity from more renewable sources.

When we asked Facebook about this in our briefing, they did say that their data centre efforts are built around many more considerations than just the source of energy that comes into the data centre. They then went on to maintain that they are impressed by Pacific Power’s commitment to moving towards renewable sources of energy (they are targeting having 2,000MW of power from renewables by 2013). And they concluded by contending that the efficiencies they have achieved in Prineville more than offsets the use of coal which powers the site.

Conclusion
Facebook tell us this new custom data centre at Prineville has a PUE of 1.07, which is very impressive.

They have gone all out on innovating their data centre and the servers powering their hugely popular site. More than that though, they are launching the Open Compute Project giving away all the specs and vendor lists required to reproduce an equally efficient site. That is massively laudable.

It is unfortunate that their local utility has such a high gen-mix of coal in its supply to besmirch an otherwise great energy and sustainability win for Facebook. The good thing though is that as the utility adds to its portfolio of renewables, Facebook’s site will only get greener.

For more on this check out the discussions on Techmeme

You should follow me on Twitter here

Photo credit FaceBook’s Chuck Goolsbee

post

Open source, open data, climate, energy and collaboration

Hard drive

James pointed me to a post yesterday about Transparency in energy usage – it made for interesting reading.

The article talks about the benefits of having open data in the energy arena. In this case, the post is specifically talking about the US Energy Information Administration‘s publishing of historical annual energy statistics for the entire US – included are data on total energy production, consumption, and trade; overviews of petroleum, natural gas, coal, electricity, nuclear energy, renewable energy, international energy, as well as financial and environmental indicators; and data unit conversion tables.

The data is downloadable in PDF, XLS and CSV formats, sliced and diced in any number of ways, or you can download it in its entirety. Amazing stuff.

By the way, if you don’t think open data can be made fascinating, you haven’t seen what Hans Rosling can do with the visualisation of statistics.

The article correctly points out though that the data, by itself, is not easily digestible. It is the combination of open data, along with the collaborative efforts of GOOD with hyperakt which makes this data far easier to digest.

And that’s key – we have seen the massive savings open source software has brought us (saving $60bn per annum, in direct costs). The other real benefits of open source though come from its crowd-sourced nature (rapid bug-fixing, security, mitigation of vendor collapse/product discontinuation, community, etc.).

Given the two recent controversies around climate science – a bit more crowd-sourcing of the data and methodologies in climate science should be welcomed by anyone seeking to add to climate science’s credibility.

With that in mind, it is great to see the Climate Code Foundation set up. The Climate Code Foundation say their goals are to promote public understanding of climate science:

  • by increasing the visibility and clarity of the software used in climate science, and by encouraging climate scientists to do the same
  • by encouraging good software development and management practices among climate scientists and
  • by encouraging the publication of climate science software as open source

The more openness and transparency there is in climate science (and every other science but especially climate science), the better for everyone (except perhaps the Lord Moncktons of the world).

You should follow me on Twitter here

Photo credit splorp