post

Apple launches ResearchKit – secure, private, open source medical research

ResearchKit

Apple announced a new initiative at its Spring Forward event yesterday – ResearchKit.

What is ResearchKit? Apple’s SVP of Operations, Jeff Williams, described it as a framework for medical researchers to create and deploy mobile apps which collect and share medical data from phone users (with their permission), and share it with the researchers.

Why is this important? Previously it has proven difficult for research organisations to secure volunteers for research studies, and the data collected from such studies is often collected, at best, quarterly.

With this program, Apple hopes to help researchers more easily attract volunteers, and collect their information far more frequently (up to once a second), yielding far richer data.

The platform itself launches next month, but already there are 5 apps available, targeting Parkinson’s, diabetes, heart disease, asthma, and breast cancer. These apps have been developed by medical research organisations, in conjunction with Apple.

The success of this approach can be seen already in this tweet:

I downloaded mPower, the app for Parkinson’s to try it out, but for now, they are only signing up people who are based in the US.

As well as capturing data for the researchers, mPower also presents valuable information to the user, tracking gait and tremor, and seeing if they improve over time, when combined with increased exercise. So the app is a win both for the research organisations, and for the users too.

Apple Does Not See Your Data

Apple went to great pains to stress that the user is in complete control over who gets to see the data. And Apple themselves doesn’t ever get to see your data.

This is obviously a direct shot at Google, and its advertising platform’s need to see your data. Expect to hear this mantra repeated more and more by Apple in future launches.

This focus on privacy, along with Apple’s aggressive stance on fixing security holes, and defaulting to encryption on its devices, is becoming a clear differentiator between Apple and Android (and let’s face it, in mobile, this is a two horse race, for now).

ResearchKit Open Source

Finally, Williams concluded the launch by saying Apple wants ResearchKit on as many devices as possible. Consequently, Apple are going to make ResearchKit open source. It remains to see which open source license they will opt for.

But, open sourcing ResearckKit is a very important step, as it lends transparency to the privacy and security which Apple say is built-in, as well as validating Apple’s claim that they don’t see your data.

And it also opens ResearchKit up to other mobile platforms to use (Android, Windows, Blackberry), vastly increasing the potential pool of participants for medical research.

We have documented here on GreenMonk numerous times how Big Data, and analysis tools are revolutionising health care.

Now we are seeing mobile getting in on the action too. And how.

post

Technology for Good – episode twenty two with David Terrar

Welcome to episode twenty two of the Technology for Good hangout. In this week’s episode we had CEO of D2C, co-founder of AgileElephant, and fellow Enterprise Irregular, David Terrar as guest on the show. As well as being a fellow Enterprise Irregular, David is an old friend, so we had a lot of fun discussing this week’s crop of stories. Last week Google held its I/O developer conference so there were plenty of Google stories breaking, but we also found time to fit in topics such as renewables, communications, and health.

Here are the stories that we discussed in this week’s show:

Climate

Renewables

Communications

Mobile

Google (!)

Wearables

Transportation

Health

post

Cloud computing companies ranked by their use of renewable energy

Cloud-Providers Renewables use updated

UPDATE: After publication of this post I was contacted by Rackspace who informed me that they do, in fact, publish their megawatt electricity consumption. it is contained in an investor report (PDF) published on their Investor Relations page. This shows Rackspace used just over 105mWh of electricity in 2013. This means that the 35% of Renewables figure corresponds to 36.8mWh (in fact it comes to 36,785kWh, or 0.037m kWh, as it is now represented in the chart above). Consequently, I adjusted the chart and moved Rackspace up a number of places in the rankings.

Cloud computing is booming. Cloud providers are investing billions in infrastructure to build out their data centers, but just how clean is cloud?

Given that this is the week that the IPCC’s 5th assessment report was released, I decided to do some research of my own into cloud providers. The table above is a list of the cloud computing providers I looked into, and what I found.

It is a real mixed bag but from the table you can see that Icelandic cloud provider Greenqloud comes out on top because they are using the electricity from the 100% renewable Icelandic electricity grid to power their infrastructure.

On the Windows Azure front, Microsoft announced in May of 2012 that it was going to go carbon neutral for its facilities and travel. Microsoft are now, according to the EPA, the second largest purchaser of renewable energy in the US. In 2013 they purchased 2,300m kWh which accounted for 80% of their electricity consumption. They made up the other 20% with Renewable Energy Certificates (RECs). And according to Microsoft’s TJ DiCaprio, they plan to increase their renewable energy purchases from 80% to 100% in the financial year 2014.

Google claim to have been carbon neutral since 2007. Of Google’s electricity, 32% came from renewables, while the other 68% came from the purchase of RECs.

SAP purchased 391m kWh of renewable energy in 2013. This made up 43% of its total electricity consumption. SAP have since announced that they will go to powering 100% of its facilities from renewable energy in 2014.

The most recent data from IBM dates from 2012 when they purchased 764m kWh of renewable energy. This accounted for just 15% of their total consumption. In the meantime IBM have purchased cloud company Softlayer for whom no data is available, so it is unclear in what way this will have affected IBM’s position in these rankings.

The most up-to-date data on Oracle’s website is from 2011, but more recent data about their renewable energy is to be found in their 2012 disclosure to the Carbon Disclosure Project (registration required). This shows that Oracle purchased 5.4m kWh of renewable energy making up a mere 0.7% of their total consumption of 746.9m kWh in 2012.

Rackspace have no data available on their site, but in email communications with me yesterday they claim that 35% of their electricity globally is from renewable sources. They declined to say exactly how much that was (in kWh) See update above.

Amazon discloses no information whatsoever about its infrastructure apart from a claim that its Oregon and GovCloud regions are using 100% carbon free power. However, they don’t back up this claim with any evidence, they don’t disclose to the Carbon Disclosure Project, nor do they produce an annual Corporate Responsibility report.

The other three cloud providers in the list, Softlayer, GoGrid, and Bluelock have no information on their websites (that I could find), and they didn’t respond to written inquiries.

I’ll be writing a follow-up post to this in the next few days where I look into the supply chain risks of utilising cloud platforms where there is no transparency around power sourcing.

post

Technology for Good – episode ten

Welcome to episode ten of the Technology for Good hangout. In this week’s show we had special guest Bill Higgins, who works on IBM’s Cloud & Smarter Infrastructure. Given the week that was in it with Google’s slashing of cloud computing pricing, and Facebook’s purchase of Oculus Rift, there were plenty of stories about cloud computing and social networks.

Here’s the stories that we discussed in the show:

Climate

Renewables

Cloud

Social

Open

Internet of Things

Misc

post

Can we hack open source cloud platforms to help reduce emissions – my Cloudstack keynote talk

This is a video of me giving the opening keynote at the Cloudstack Collaboration conference in Las Vegas last December. The title of my talk was Can we hack open source cloud platforms to help reduce emissions and the slides are available on SlideShare here if you want to download them, or follow along.

Be warned that I do drop the occasional f-bomb in the video, so you might want to listen to this with headphones on if there are people nearby with sensitive ears 😉

And I have a transcription of the talk below:

Good morning everyone! I’m absolutely astounded of the turn out at this time on a Saturday morning. I said to Joe yesterday evening, I think it was, that I reckoned it would be just me and the AV guy here this morning but now you’ve turned up. That’s a fantastic, phenomenal. Thank you so much. I hope we make it worth your while. My talk, Joe mentioned I’m from RedMonk. RedMonk is an analyst firm. I work on the green side of a house, so I’m all about energy and sustainability. I’m talking about using open source cloud platforms to measure and report energy and emissions from cloud computing.

A couple of quick words about myself first. As I said, I lead analyst energy and sustainability with RedMonk. You can see there, my blog is on greenmonk.net. My Twitter account is there. My email address is there. My phone number is there. Please don’t call me now. I’m using the phone as my slide forwarder. SlideShare, I’ll have this talk up on SlideShare shortly.

Also, a couple of companies I’ve worked with. I worked to the company called “Zenith Solutions” back in the mid-’90s. It’s a company that I set up in Ireland. As we called it at the time, it was a web applications company. Web applications at that time morphed into SaaS, “Software as a Service.” Back in the mid to late 90s, I was setting up these Software as a Service Company, so I knew a little bit about cloud. Then Chip Electronics was an ERP company, but it was a Software as a Service delivered ERP. That was around 2002. CIX, the other company that’s there.

CIX is a data center company that I founded in 2006 in Ireland. I kind of know a little bit about cloud both from the software and from the hardware side. I’ve setup a data center and I’ve also setup software companies dealing with cloud stuff. Like I say, a little bit of the background in it. I know what I’m talking about, not that much, but I’ll bluff it.

This is a report. It’s a graph from a report that came out just a couple of weeks ago. It’s from WSP Environmental and the NRDC. Basically, what they’re saying in this report, it’s a long report, the link is at the bottom there. As I say, this talk will be on SlideShare, so you can link on the link in SlideShare and get straight to the report. What the report is saying basically is that cloud computing is green. There have been a couple of reports like that which have said that. Most of them have been tainted before now. There was one that Microsoft helped put out, obviously Microsoft have got a foot in the game so you kind of wonder about that one. There was another one that was put out by the Carbon Disclosure Project, but it was paid for by AT&T. That was highly suspect. This one’s actually quite good. They’ve done quite a bit of work on it. You actually have to take it seriously unlike the previous two and it does seem to suggest that cloud computing is green, and that’s good.

Previous ones, as I say were suspect. The issue with this that I have and it’s a small issue, but this issue or this report is a really good report but it’s speculative. It says cloud computing should be green. Probably, is green. Maybe green, but they’re not working on any hard data and that’s where we’ve got a serious problem with cloud computing.

Taking a step sideways for a second, this is a guy called Garret Fitzgerald. Garret Fitzgerald was a politician in Ireland in the ’80s and ’90s. He died last year. A very unusual politician because he was one of the very few politicians who actually have integrity, very well-know for his integrity. He was also not just known for his integrity, but he was an academic. He came from an academic background. He worked in Trinity College Dublin as a statistician, so he was a data guy.

Now, in the mid-’40s, the Aeroflot, Russian Airline Company, it was at ’47 I think or ’49, for the first time, published their flight schedule. They’d never done this before. They published their entire flight schedule, their global flight schedule. Garret Fitzgerald looked at this, analyzed it and figured out he could know by going through this in detail, he could figure out the exact size of the Aeroflot fleet down to the number and types of planes they had in their fleet, and this was a state secret.

This was nothing that had ever been published before, but by analyzing their schedules, he worked it out and he published it, and as a result, the KGB had a file on him because they thought he was a spy.

Two things about this slide, first is you do a creative common search on Flickr for KGB, and this is one of the images you’ll find. It’s got a KGB logo and his got a cat, so you got two memes right there. A, the internet is fucking awesome and B, well the main thing to take away from this is that there is no such thing as security by obscurity. Hiding your data will not work. Somebody will figure the damn thing out. That’s where we’ve got a big issue with cloud computing because there is absolutely no transparency in cloud computing.

This is a blog post that I’ve put up. If you follow greenmonk, which is where I blog at greenmonk.net, you’ll find there’s a ton of blog posts on this very topic, the lack of transparency in cloud computing. I have done blog posts about it. I’ve given webinars about it. I’ve hassled people about in the space. The SalesForces, the Rackspaces, I’ve hassled them all.

Recently, the New York Times picked up the story. I’m not going to say it has anything to do with me, they actually run a really good story. Again, the link is at the bottom there. One of the things that they have mentioned in that story — please do go and click on that link and read that article. It’s a really good article.

One of the things they have mentioned in that article is a McKinsey study. In that McKinsey study, they say that globally for data centers, somewhere between six percent and 12%, depending on the data center, somewhere between six percent and 12% of the power going into the servers in the data centers is used for computing. The other 88% is used for elasticity. It’s used to keep them going in case there’s a burst of activity, so 88%, if we take a conservative look, 88% of the power going into those servers is the E in Elastic Cloud, horrific waste.

Do you think that people’s often mistake in this area, is people often equate or conflate energy with emissions, and that’s a mistake. They are not the same thing, not at all. The reason they are not is because if you take the example of — for example, the Facebook Data Center in Prineville, Oregon, a fabulous data center. They’ve opened sourced it, the whole open compute project. They’ve opened sourced the entire building on this data center.

The data center, if you know anything about data center statistics, there’s a metric for data centers called the PUE. The PUE is the Power Usage Efficiency. The closer you are to one, the more efficient you are. Facebook’s data center comes in around 1.07 or 1.08, depending on time of the year on usage and stuff like that, but it’s in and around 1.08. It’s almost unheard of efficiency, 1.5 is kind of average, 2.0 is older data centers, and 3.0 is dirty. This is 1.07 or 1.08.

Unfortunately, although it’s extremely efficient — this is Facebook’s numbers here, 1.08 plus their computing power has declined by 38%, but the problem with that is, this data center is powered by company called PacifiCorp. PacifiCorp are the local utility in Oregon, in Prineville where this is based.

PacifiCorp mines 9.6 million tons of coal every year. It doesn’t matter how efficient your data center is. If you’re mining 9.6 million tons of coal to run your Facebook data center, it’s not green. I don’t care how efficient it is. It’s not a green.

It’s not just Facebook, it’s not just Prineville, Dublin, in Ireland, I’m Irish — guilty. Dublin has become a center for cloud computing as well. All of the big companies are there. Microsoft is there, they got their big Live servers there, Google are there, Amazon are there, they’ve all got data centers there. Ireland, unfortunately, gets 84% of its electricity from fossil fuels. Again that’s not very green. It’s not just Ireland, the U.K. is another big center for cloud computing in London, and again, over 90% of the electricity in the U.K. comes from fossil fuels. This is really, really bad stuff.

Now, if you look at this chart, this is why I say that the PUE which is in the middle column here, isn’t a whole lot important because as I said, if you look at the bottom row there, it’s got a PUE of three I said that was really dirty. Top row, PUE of 1.5 is at the average, middle row PUE of 1.2 kind of in the middle, but if you look at the power source coming into these putitive data centers, so your typical one, the top line, typical one has a supply carbon intensity of half a kilo per kilowatt hour, that’s pretty standard. If that has a data center PUE of 1.5, then you’re getting simple math, 0.75 a kilo per kilowatt hour. If you have a good PUE of 1.2, but with coal fired power coming at 0.8 of a kilo per kilowatt hour, you’re now looking at IT carbon intensity of 0.96.

Look at the bottom line, a PUE of three, one of the dirtiest data centers you can get, but it’s powered almost all by renewables, it’s not all because it’s got a 0.2 kilograms and a PUE of three, it still comes in at an IT carbon intensity of 0.6, which is far better than the 1.2 PUE or the 1.5 on typical. The take home message from this slide is that it’s the source of the electricity is what determines the carbon footprint of your cloud, not the efficiency of your data center.

Now, if we look at some of the cloud providers that are out there today and if I left anyone out, apologies, I just stuck these logos up based on the availability of the logos. It’s not an any kind of research or anything but that.

If we look at the cloud providers that are out there, these ones are semi-clean. If we look, for instance, at Rackspace, they have a data center in the U.K. which they claim as 100% powered by renewables. Now, they haven’t given us a whole load of data, but let’s just take the word on it. If you go with Rackspace and you go with their U.K. data center it’s supposedly 100% green, we’ll see. Google, Google have done a really good job on investing in renewables. They spent almost a billion dollars on buying into Windfarms, power purchase agreements with big Windfarms the whole thing. They’ve gone out on a serious limb, in terms of renewables. I’m pretty positive about them. They’re still doing a lot of the old buying carbon credits and stuff like that, but they got old data centers that they need to top up with carbon credits.

Green Cloud is an interesting one. Green Cloud are company that bill themselves as an AWS replacements, dropping AWS replacement and why they are cool is because — pun intended.

They’re cool because they’re based in Iceland. The electricity grid on Iceland is 100% renewable, its 30% geothermal, 70% hydro. The entire grid is a 100% renewable energy and it’s baseload energy and what’s even more interesting about it, as a grid is, there are 300,000 people living in Iceland, that’s it — 320,000. They’ve realized that they got this energy infrastructure and way more energy than they can every use, so they decided to invite people who need lots of energy. I’m not talking about data centers. I’m talking about Aluminium Smelting Plants.

So, they got Aluminium Smelting Plants in Iceland. These guys take up 500 megawatts at a time. A big data center is 50 megawatts. They’re 10 times the biggest data center you’ve ever come across, in terms of the power utilization. They are on all day, everyday, 24/7, 365, it’s a flat line. Any electricity grid you look at, if you look at the demand curve, it goes like that everyday. Peaks in the morning, when people get up, peaks in the late afternoon when people come home from work. Iceland, the flat line all the way. It is the only country whose electricity grid is just flat all the time. It’s always on. It’s always flat. There is no movement in it or whatsoever. It is the most reliable electricity grid in the world. It’s also one of the cheapest. It’s also 100% green.

If you are looking to site a data center, I recommend Iceland. Greenqloud are based there, and as I say, their Cloud is obviously 100% green. We’ll come back to them.

Amazon put out this report earlier this year where they said that, “Both their Oregon and their GovCloud were a 100% carbon free”. That sounds nice. Unfortunately, when you actually ask them about it, so this is Bruce Durling, a guy I know in the U.K. He asked Jeff — it’s a story for this 100% green claim that it’s just going out. Jeff says, “You know, we don’t share any details about it, but I’m happy to hear you like it.” Bruce comes back and says, “How can we verify if this is true, there are lots of different ways to claim zero carbon.” And then you’ll just hear cricket chirps, nothing, no data, and no response. Bruce isn’t the only guy, several people took Jeff up on this asked him, “What’s the story with your claim for 100% green in these two clouds? “Nothing, nothing.” And it’s appalling that they are not talking because this is the kind of stuff we need to know. There is no data coming at of a lot of the cloud manufacturer or cloud providers.

Looking again at the cloud providers I’ve mentioned, if we look at some of the ones who are providing some data. If we look, for example, at SAP, SAP has got a really good sustainability report that they release every year. In fact they release quarterly even better. Unfortunately, the only data, they give us about their Cloud, is that eight percent of their carbon emissions are from their data centers. That’s as granular as it gets. We know no more about their carbon emissions, about their Cloud than that.

If we look at Salesforce, Salesforce go a little further. Salesforce have got this carbon calculator under site which is interesting. If you choose as I did in this screen shot, you can see I chose — I was based in Europe which I am. I decided to say I was in a company of 10,000 plus, and I decided to say, “Look, I’m going from on-premise to Salesforce. So, they tell me, “Fantastic! You’re going from on-premise, 10,000 plus based from Europe you’re going to save 86% and 178 tons of carbon by moving to Salesforce, but of course that’s complete horse shit because Europe is not homogenous.

If I’m based in France, 80% of the energy in France is nuclear. If I’m based in Spain, which I am, 40% of the energy in the Spanish grid comes from renewables. There is no way that if I move my on-premise from France or Spain to Salesforce that I’m saving 178 tons of coal per annum. In fact, if I move to Salesforce, my carbon emissions are going to go up not down because Salesforce’s data centers are in the U.S. which is 45% coal or they’re in Singapore. Singapore is — if memory serves 93% fossil fuel so there is no way moving to Salesforce from a lot of the European countries is a step on the right direction in terms of green.

The other thing that they have — you can click on the link at the bottom of this as well on the Salesforce site. This is where they have your daily carbon savings. There are two problems with this, the first is — this screen shot was a couple of days ago and you could see they’re talking about the 13th of September is the most recent date, so it’s two months or more out-of-date. The second is they’re talking about carbon savings, which is bullshit made-up number. What they should be talking about is actual carbon emissions because they can just make up the carbon savings because it’s basing where you’re from. Like I say if I’m in Spain and my carbon savings are at a zero going to Salesforce. They should be talking about emissions not carbon savings of completely the wrong metric.

I talked about Greenqloud. Greenqloud, have this on their site which is nice. You log into Greenqloud — over the righthand side is part of your dashboard, you get your carbon figures. They are as well, and this is a conversation I’m having with them at the moment, they are also talking about the CO2 savings, they’re not talking about actual emissions. There are emissions obviously, if you’re working with Greenqloud, their CO2 footprint is negligible because it’s Icelandic, but there is that carbon expended between your laptop or your desktop and going to them. There is carbon put out there but it’s negligible compared to mostly of the other providers. The difficulty with this, as they say, is they’re talking about CO2 savings not CO2 emissions. I’m hoping to get them to change that.

Why don’t the Cloud providers provide this data? There are number of reasons. I’m speculating here. I don’t know. I’ve asked them, they’ve all said different reasons. One of them I’m going to think is competitive intelligence. They don’t want people to know what their infrastructure is. They don’t want people to do the Garret Fitzgerald and reverse engineer, to find out what it is they’re actually using to power their facilities. Another is maybe they don’t actually want people to know how much CO2 they’re pushing out. It’s not a happy story.

The other is, in fairness, there’s a lack of standards out there about cloud companies reporting emissions because how do you report emissions around cloud computing? Do you do it at CO2 per flop? What’s the metric? We don’t know, no one is doing it yet so we don’t know.

Peter Drucker, the management guru, is famous for saying, “If you can’t measure it, you can’t manage it.” That holds true. That does hold true for everything, and particularly in this space.

I’m going to go through a quick recap of 2012 and this is not going to be pleasant. This is an image taken from the U.S. Drought Monitor in September but it’s even more so now. So far, U.S. agriculture has loss $12 billion just in Q3 because of drought. It’s not just drought, there’s been massive wildfires globally, not just in the U.S. There’s been massive floodings everywhere, not just the floodings, but also a new report came out in the last week, and again the link is at the bottom, which says that, “Sea level rise globally is actually 60% higher than had been previously calculated.” They had thought sea levels were rising two millimeters per annum. It turns out sea levels are actually rising 3.2 millimeters per annum.

We have had more than 2000 heat records in June alone of this year in the U.S. alone, the sea ice — I got a chart here, you can look it up afterwards. I’ve got another chart here you can look it up afterwards, and I got an image here. It’s hard to see, but that’s the polar ice cap in September 13th when it was at its minimum.

The orange line outside that is the 30-year average at that time for the sea ice extent. It’s almost 50% less than what it should have been at that time. It’s scary. It’s scary stuff because when we lose the arctic and we’ve lost 50% of it this year, when we lose the arctic, you got a feedback mechanism because when you don’t have the ice to reflect the heat, you’ll got the water taking in the heat, and it gets hotter and it’s a feedback mechanism so the ice underneath melts as well, so you no longer have multi-year ice.

You got methane emissions, that’s literally methane coming from underneath the ice from organisms that had been frozen, but because everything heated up a little bit. They started producing methane. Now, another report out in the last week in the UNDP says, “The thawing of the permafrost is going to cause us enormous problems and it hasn’t been taken into account previously in any of the climate models.” None of the IPCC reports, up until now, have taken permafrost thawing into account because they think it was going to be significant. Suddenly, they’re realizing that the thawing of the permafrost is decades ahead of where they thought it would be. This is serious stuff because this could be 40% of the global carbon emissions soon, not good. It’s a big feedback mechanism again.

So okay, the Cloud. The hell is that going to do with cloud? I get it. Cloud isn’t responsible for all these emissions. I know that, but it’s responsible for some of them, at least two percent of the global carbon emission is coming from IT and that’s a 2006 Gartner figure(ph). So, it’s likely, significantly higher at this point.

What’s that going to do with open source? Why are we here? Well, I got to think that we’ve got this open source cloud platforms out there. There are a significant number of developers in the room. I think it’s entirely possible that people in this room could start writing patches for the open source cloud platforms that are there, so that the Cloud providers no longer have an excuse to say, “Oh, we can’t do it because it’s not in the software.”

If you guys start writing the software for them, start doing the energy emissions, reporting, and measurement software writing those patches for the open source global platforms. Then suddenly, it gets in to the core. It starts being deployed back out to the companies that are using these platforms.

This is the company called AMEE. Interestingly they’re a U.K. start-up, not really a start-up, they’re around four years now, but they named the company AMEE as the “Avoiding Mass Extinction Engine.” They don’t boast about that, but that’s where they got the name. They are an open source platform for carbon calculation. They’ve got open APIs. If you guys want to do this stuff, work with the AMEE open APIs because they’ve got all the data.

Then, as I say, it gets thrown back out to the client companies of the open source cloud platforms and then we’ve get serious traction. This is what we need to have happen. By the way, there’s a company called Mastodon C. I mentioned AMEE already. There’s another company called Mastodon C out there, who has a dashboard already in place, showing us the carbon emissions of the various cloud providers. It’s not great. They’re guessing it because the cloud providers aren’t reporting it. They’re guessing it based on the location of the cloud companies and utility companies who provide them with their energy but it’s better than nothing.

One other thing I should mention and I don’t want to be totally negative, but this should scare the fuck out of everyone in this room. PricewaterhouseCoopers, not known as being green, agitators, activists, there are the largest of the big four accounting companies. They came out with this report two weeks ago. It’s their carbon report. They come out with it annually. This report tells us that between the years 2000 and 2011 globally, our carbon emissions went down by 0.8% every year. That’s good, 0.8% reduction carbon emissions year on year.

The trouble is we’ve decided we want to keep our global warming figures. We want you to cap the warming at two degrees centigrade. Beyond that, it starts to get very hairy. The temperature has already gone up 0.8 of a degree centigrade, so we’ve got 1.2 degrees left.

According to PwC, the only way to keep this at two degrees is to reduce our carbon emissions not by 0.8%, as we’ve been doing, but to reduce our carbon emissions 5.1% every year between now and 2050. Six times the carbon reductions we’ve been doing for the last 11 years, every year for the next 38 years. So, sorry to be on a bit of a downer, but I have some good news.

This is Jim Hagemann Snabe. Jim is the co-CEO of SAP. I had a conversation with him in Madrid last week about this very topic and about… they are a cloud provider, I was asking him, “Why the hell aren’t you talking? Why aren’t you giving us your numbers? It wasn’t something he was aware of, it wasn’t something he had thought about, and Jim is actually a good guy. He’s actually a sustainability guy. Anytime you hear him talk, in the first three, four minutes of his talk, any talk he gives, he’ll bring up sustainability. Maybe sideways, he’ll talk about resource constraints or something, but he’s always thinking about this. When I brought this up with him, he was blown away because it hadn’t occurred to him at all and he said, “Tom you’re absolutely right, this is a space I want SAP to lead in.” Hopefully, something will come out of that, but it’s not just that.

This is Robert Jenkins. Robert is the CEO of CloudSigma, a Swiss-based company who are a Cloud Company. I’ve had conversations with him about this as well, and he is talking again about doing this also, about opening and being transparent about their emissions, so we’re getting some traction now in the space. Finally, Greenqloud, Greenqloud’s CEO is a guy called Eiki and I’m not going to try to pronounce his surname because it’s Icelandic and it’s just completely unpronounceable. Eiki has given me permission here today, to announce on behalf of Greenqloud that Greenqloud, because they are a CloudStack customer or user, and they have this energy on emissions stuff already built-in.

In Q2 of next year, they’re going to contribute their code back into CloudStack. So, for me, I think that’s a serious win because then it gets distributed back out. For me, that was a highlight of my last couple of week’s work, just getting Eiki to agree to in Q2 next year contributing that back into CloudStack.

So, that’s it. That’s me. Adding emissions, metrics and reporting to cloud computing will help reduce emissions. That’s it.

post

Cloud Computing: Google Apps cloud has a relatively high carbon intensity

Cloud

I have been researching and publishing on Cloud Computing for quite some time here. Specifically, I’ve been highlighting how it is not possible to know if Cloud computing is truly sustainable because none of the significant Cloud providers are publishing sufficient data about their energy consumption, carbon emissions and water use. It is not enough to simply state total power consumed, because different power sources can be more, or less sustainable – a data center run primarily on renewables is far less carbon intensive than one that relies on power from an energy supplier relying on coal burning power stations.

At Greenmonk we believe it’s important to get behind the headline numbers to work out what’s really going on. We feel it’s unacceptable to simply state that Cloud is green and leave it at that, which is why we’ve been somewhat disappointed by recent work in the field by the Carbon Disclosure Project. We would like to see more rigour applied by CDP in its carbon analytics.

Carbon intensity should be a key measure, and we need to start buying power from the right source, not just the cheapest source.

I was pleasantly surprised then yesterday when I heard that Google had published a case study ostensibly proving that Cloud had reduced the carbon footprint of at least one major account.

However, it is never that straightforward, is it?

The Google announcement came in the form of a blog post titled Energy Efficiency in the Cloud, written by Google’s SVP for Technical Infrastructure, Urs Hölzle. I know Urs, I’ve met him a couple of times, he’s a good guy.

Unfortunately, in his posting he heavily references the Carbon Disclosure Project’s flawed report on Cloud Computing, somewhat lessening the impact of his argument.

Urs claims that in a rollout of Google Apps for Government for the US General Services Administration,

the GSA was able to reduce server energy consumption by nearly 90% and carbon emissions by 85%.

An 85% reduction in carbon emissions sounds very impressive – but how does Google calculate that figure? Also worth considering is the age of the server estate – any data center that decommissions older servers in favour of new ones is likely to see an efficiency bump. Assuming the GSA servers running Microsoft apps were more than five years old, they would have seen a considerable efficiency bump simply by running the apps on new servers, on premise or off. Without disappearing down a rathole, its also worth noting cradle to cradle factors in server manufacturing – supply chains consume carbon.

We looked at a whitepaper titled Google Apps: Energy Efficiency in the Cloud [PDF], where the search company shares some of the methodology behind the blog post. We would like to see a lot more detail about assumptions and methods.

The key reference to how Google calculated carbon emissions is this line:
The following summary tallies up every GSA server dedicated to email and collaboration across 14 locations in the continental U.S. and applies the appropriate PUEs, electricity prices, and carbon intensities for each location

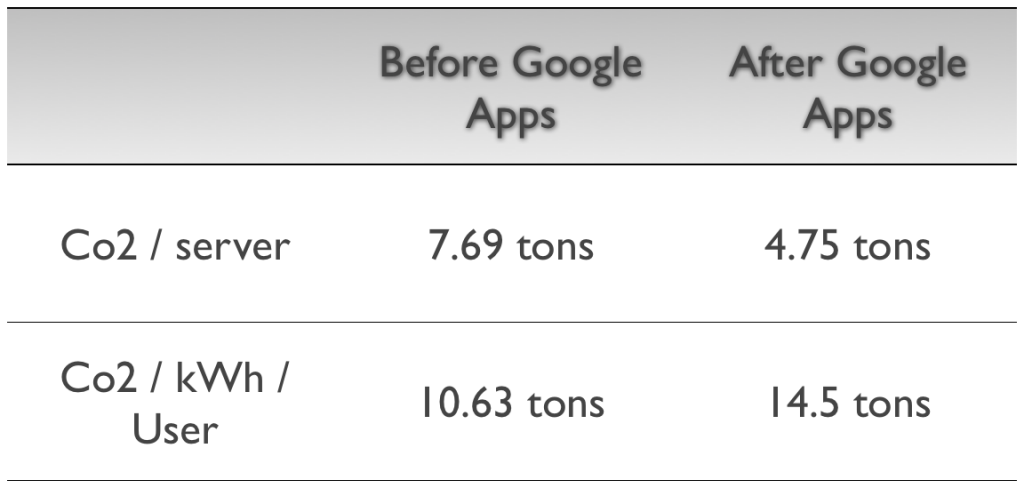
Here’s the table:
Google Apps GSA case study

The data in the table above is interesting but if you look at the carbon information, you start to notice something strange – here’s a slightly different view on Google’s data:

Google Apps carbon intensity

While it is no real surprise that Google’s servers produce less CO2 per annum than the GSA’s (4.75 vs 7.69 tons), what is very surprising (to me at least) is the fact that Google’s facilities are significantly more carbon intensive than the GSA’s were (14.5 vs 10.63 tons of CO2 per kWh).

In simple terms, carbon intensity is a measure of the amount of CO2 released in the generation of electricity. The data above, clearly show that the data centres hosting the Google Apps Cloud are not optimised for reduced emissions (the best way for data centers to optimise for reduced emissions is to source electricity generated from renewable sources).

I guess the good news is that, while Google has helped the GSA to reduce its carbon emissions, there’s plenty of room for improvement!

I reached out to Urs for a response to this and because he’s traveling at the minute, the only answer I received pointed out that since 2007 Google’s net emissions are zero. And, in fairness to Google, they do fund some worthwhile offsetting projects, as you can see in the video below (check out the farmer towards the end, he’s just awesome!).

Cloud photo credit mnsc

post

Facebook hires Google’s former Green Energy Czar Bill Weihl, and increases its commitment to renewables

Christina Page, Yahoo & Bill Weihl, Google - Green:Net 2011

Google has had an impressive record in renewable energy. They invested over $850m dollars in renewable energy projects to do with geothermal, solar and wind energy. They entered into 20 year power purchase agreements with wind farm producers guaranteeing to buy their energy at an agreed price for twenty years giving the wind farms an income stream with which to approach investors about further investment and giving Google certainty about the price of their energy for the next twenty years – a definite win-win.

Google also set up RE < C – an ambitious research project looking at ways to make renewable energy cheaper than coal (unfortunately this project was shelved recently).

And Google set up a company called Google Energy to trade energy on the wholesale market. Google Energy buys renewable energy from renewable producers and when it has an excess over Google’s requirements, it sells this energy and gets Renewable Energy Certificates for it.

All hugely innovative stuff and all instituted under the stewardship of Google’s Green Energy Czar, Bill Weihl (on the right in the photo above).

However Bill, who left Google in November, is now set to start working for Facebook this coming January.

Facebook’s commitment to renewable energy has not been particularly inspiring to-date. They drew criticism for the placement of their Prineville data center because, although it is highly energy efficient, it sources its electricity from PacificCorp, a utility which mines 9.6 million tons of coal every year! Greenpeace mounted a highly visible campaign calling on Facebook to unfriend coal using Facebook’s own platform.

The campaign appears to have been quite successful – Facebook’s latest data center announcement has been about the opening of their latest facility in Lulea, Sweden. The data center, when it opens in 2012, will source most of its energy from renewable sources and the northerly latitudes in Lulea means it will have significant free cooling at its disposal.

Then in December of this year (2011) Facebook and Greenpeace issued a joint statement [PDF] where they say:

Facebook is committed to supporting the development of clean and renewable sources of energy, and our goal is to power all of our operations with clean and renewable energy.

In the statement Facebook commits to adopting a data center siting policy which states a preference for clean and renewable energy and crucially, they also commit to

Engaging in a dialogue with our utility providers about increasing the supply of clean energy that power Facebook data centers

So, not alone will Facebook decide where their future data centers will be located, based on the availability of renewable energy, but Facebook will encourage its existing utility providers to increase the amount of renewables in their mix. This is a seriously big deal as it increases the demand for renewable energy from utilities. As more and more people and companies demand renewable energy, utilities will need to source more renewable generation to meet this demand.

And all of this is before Google’s former Green Energy Czar officially joins Facebook this coming January.

If Bill Weihl can bring the amount of innovation and enthusiasm to Facebook that he engendered in Google, we could see some fascinating energy announcements coming from Facebook in the coming year.

Photo credit Jaymi Heimbuch

post

Power Usage Efficiency (PUE) is a poor data center metric

Problems with PUE

Power Usage Effectiveness (PUE) is a widely used metric which is supposed to measure how efficient data centers are. It is the unit of data center efficiency regularly quoted by all the industry players (Facebook, Google, Microsoft, etc.).
However, despite it’s widespread usage, it is a very poor measure of data center energy efficiency or of a data center’s Green credentials.

Consider the example above (which I first saw espoused here) – in the first row, a typical data center has a total draw of 2MW of electricity for the entire facility. Of which 1MW goes to the IT equipment (servers, storage and networking equipment). This results in a PUE of 2.0.

If the data center owner then goes on an efficiency drive and reduces the IT equipment energy draw by 0.25MW (by turning off old servers, virtualising, etc.), then the total draw drops to 1.75MW (ignoring any reduced requirement for cooling from the lower IT draw). This causes the PUE to increase to 2.33.

When lower PUE’s are considered better (1.0 is the theoretical max), this is a ludicrous situation.

Then, consider that not alone is PUE a poor indicator of an data center’s energy efficiency, it is also a terrible indicator of how Green a data center is as Romonet’s Liam Newcombe points out.

Problems with PUE

Consider the example above – in the first row, a typical data center with a PUE of 1.5 uses an average energy supplier with a carbon intensity of 0.5kg CO2/kWh resulting in carbon emissions of 0.75kg CO2/kWh for the IT equipment.

Now look at the situation with a data center with a low PUE of 1.2 but sourcing energy from a supplier who burns a lot of coal, for example. Their carbon intensity of supply is 0.8kg CO2/kWh resulting in an IT equipment carbon intensity of 0.96kg CO2/kWh.

On the other hand look at the situation with a data center with a poor PUE of 3.0. If their energy supplier uses a lot of renewables (and/or nuclear) in their generation mix they could easily have a carbon intensity of 0.2kg CO2/kWh or lower. With 0.2 the IT equipment’s carbon emissions are 0.6kg CO2/kWh.

So, the data center with the lowest PUE by a long shot has the highest carbon footprint. While the data center with the ridiculously high PUE of 3.0 has by far the lowest carbon footprint. And that takes no consideration of the water footprint of the data center (nuclear power has an enormous water footprint) or its energy supplier.

The Green Grid is doing its best to address these deficiencies coming up with other useful metrics such as, Carbon Usage Effectiveness (CUE) and Water Usage Effectiveness (WUE).

Now, how to make these the standard measures for all data centers?

The images above are from the slides I used in the recent talk I gave on Cloud Computing’s Green Potential at a Green IT conference in Athens.

post

Google, Microsoft, shutter their home energy management offerings

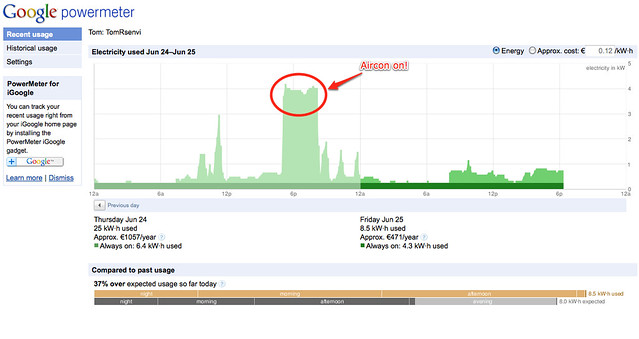
Google PowerMeter

Last week Google announced that it was shutting down its PowerMeter application (a screenshot of which is above). A couple of days later Microsoft divulged that it was closing its PowerMeter competitor, Microsoft Hohm.

This is very disappointing because the two products were decidly disruptive and, as Google mentioned, studies show that having simple access to energy information helps consumers reduce their energy use by up to 15%. Both services cited lack of uptake as the reason for their termination.

In Microsoft’s case, there is a very good reason why this was so, it never opened up Hohm beyond the US – if you only allow 4% of the world’s population access to your application, you can’t really claim to be surprised if you don’t see significant uptake.

PowerMeter though, in its announcement said –

our efforts have not scaled as quickly as we would like, so we are retiring the service

Why then did Google’s PowerMeter not scale, despite being open to all comers?

Simply because Google were too early to market, I suspect.

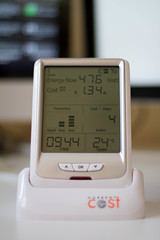
CurrentCost

CurrentCost

Being a trailblazer meant that getting data into PowerMeter was not trivial. The only way to make it easy for data entry would have been if Google managed to sell its services to utility companies but Google had very little success with this approach. Why would utility companies allow Google access to their customer usage data? That was never a runner.

The alternative was to use a device like a CurrentCost – an in-home energy meter which had the ability to upload its data to PowerMeter. However, as I detailed in this post, there were multiple problems with the CurrentCost meters which meant they were never a reliable option for PowerMeter data entry.

Obviously, if you can’t get your data into PowerMeter, it is not going to be of much use to you.

The need for real-time energy information is obvious. It is very difficult to identify wasteful electricity practices when you receive your consumption information (i.e. your bill) up to two months after you used it.

So what now?

Well, it looks like we are back to getting this information from our utility companies. Things are changing (albeit at a glacial pace) on that front though. As I mentioned in my post on Centrica’s Smart Meter Analytics implementation, the technological barriers to rolling out a compelling home energy management have come way down.

Now if utility companies actually roll out energy management applications properly, we could see significant reductions in wasteful energy use.

Photo credit Tom Raftery

post

Learnings from Google’s European Data Center Summit

Google's EU Data Center Summit conference badge

I attended Google’s European Data Center Summit earlier this week and it was a superb event. The quality of the speakers was tremendous and the flow of useful information was non-stop.

The main take home from the event is that there is a considerable amount of energy being wasted still by data centers – and that this is often easy to fix.

Some of the talks showed exotic ways to cool your data center. DeepGreen, for example, chose to situate itself beside a deep lake, so that it could use the lake’s cold water for much cheaper cooling. Others used river water and Google mentioned their new facility in Finland where they are using seawater for cooling. Microsoft mentioned their Dublin facility where they are using air-side economisation (i.e. it just brings in air from outside the building) and so is completely chiller-less. This is a 300,00sq ft facility.

IBM’s Dr Bruno Michel did remind us that it takes ten times more energy to move a compressible medium like air, than it does to move an non-compressible one like water but then, not all data centers have the luxury of a deep lake nearby!

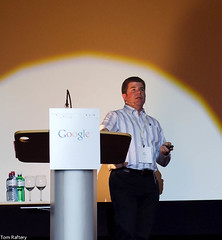
Google's Joe Kava addressing the European Data Center Summit

Both Google and UBS, the global financial services co., gave what were hugely practical talks about simple steps to reducing your data center’s energy footprint.

Google’s Director of Operations, Joe Kava (pic on right) talked about a retrofit project where Google dropped the PUE of five of its existing data centers from 2.4 down to 1.5. They did this with an investment of $25k per data center and the project yielded annual savings of $67k each!

What kind of steps did they take? They were all simple steps which didn’t incur any downtime.

The first step was to do lots of modelling of their airflow and temperatures in their facilities. With this as a baseline, they then went ahead and optimised the perforated tile layout! The next step was to get the server owners to buy into the new expanded ASHRAE limits – this allowed Google to nudge the setpoint for the CRACs up from its existing 22C to 27C – with significant savings accruing from the lack of cooling required from this step alone.

Further steps were to roll out cold aisle containment and movement sensitive lighting. The cold aisles were ‘sealed’ at the ends using Strip Doors (aka meat locker sheets). This was all quite low-tech, done with no downtime and again yielded impressive savings.

Google achieved further efficiencies by simply adding some intelligent rules to their CRACs so that they turned off when not needed and came on only if/when needed.

UBS’ Mark Eichenberger echoed a lot of this in his own presentation. UBS has a fleet of data centers globally whose average age is 10 years old and some are as old as 30. Again, simple, non-intrusive steps like cold-aisle containment and movement sensitive lighting is saving UBS 2m Swiss Francs annually.

Google’s Chris Malone had other tips. If you are at the design phase, try to minimise the number of conversion steps from AC<->DC for the electricity and look for energy efficient UPS’.

Finally, for the larger data center owners, eBay’s Dean Nelson made a very interesting point. When he looked at all of eBay’s apps, he saw they were all in Tier 4 data centers. He realised that 80% of them could reside in Tier 2 data centers and by moving them to Tier 2 data centers, he cut eBay’s opex and capex by 50%

Having been a co-founder of the Cork Internet eXchange data center, it was great to hear that the decisions we made back then around cold aisle containment and highly energy efficient UPS’ being vindicated.

Even better though was that so much of what was talked about at the summit was around relatively easy, but highly effective retrofits that can be done to existing data centers to make them far more energy efficient.

You should follow me on Twitter here
Photo credit Tom Raftery