post

The Global Reporting Initiative, their new CEO, Social, Mobile and Big Data

Michael Meehan - GRI new Chief Executive

We were delighted to hear this week that friend of GreenMonk’s for many years now, Michael Meehan was recently appointed as CEO of the Global Reporting Initiative (GRI).

The GRI is a non-profit organisation that produces one of the world’s most prevalent framework’s for sustainability reporting. One of the GRI’s main aims is to make sustainability reporting by all organisations as routine as, and comparable to, financial reporting.

Michael takes over the GRI at an interesting time. As we reported here on GreenMonk recently, the interest in sustainability reporting is on the rise globally

carbon scores are now not only showing up at board level, but are also being reported to insurance companies, and are appearing on Bloomberg and Google Finance. He put this down to a shift away from the traditional regulation led reporting, to a situation now where organisations are responding to pressure from investors, as well as a requirement to manage shareholder risk.

In other words the drivers for sustainability reporting now are the insurance companies, and Wall Street. Organisations are realising that buildings collapsing in Bangladesh can have an adverse effect on their brand, and ultimately their bottom line.

On a call to Michael earlier this week to congratulate him on his new role, he mentioned that while around 6,000 organisations currently report to the GRI, his aim is to increase that number to 25,000 organisations.

To do that, at the very least, the GRI needs to embrace social, mobile, and Big Data.

The GRI has traditionally operated below the radar, but in order to grow the GRI, never mind growing it to 25,000 reporting organisations, working quietly is not sustainable. It has to become more aggressive with outbound communications – social in particular. While the GRI has a Twitter account with over 15,000 followers, there’s no mention of the account anywhere on the GRI’s website. Worse again, the organisation’s Facebook page is one automatically generated by Facebook based on Facebook users posts and interests (!), and the organisation’s Youtube channel was similarly generated automatically by YouTube’s video discovery system.

On the mobile front, the organisation’s website is not mobile aware. Nor does it have any mobile apps in the main app stores. In a time when more and more web browsing is going mobile, the GRI urgently needs to formulate a mobile strategy for itself.

And finally, on the Big Data front, in our conversation Michael expressed a definite interest in making the GRI’s terabytes of organisational information available as a platform for developers. The data is a huge repository of information going back over years. The ability to build analytics applications on top of this would yield massive benefits, one has to think.

Fortunately for the GRI, Michael is a serial entrepreneur with a history of successful exits in the sustainability space. If anyone can modernise the GRI, he can. We wish him all the best in his new role.

post

Technology for Good – episode twenty five with SAP Mentor Chris Kernaghan

Welcome to episode twenty five of the Technology for Good hangout. In this week’s episode we had cloud architect and SAP Mentor Chris Kernaghan as the guest on our show. This was not Chris’ first time co-hosting the Technology for Good show, so as an old hand, I knew this was going to be a fun show, and so it was. We covered a lot of topics in the show, including the repeal of carbon tax in Australia, IBM and Apple’s enterprise partnership, and Microsoft’s shedding of 18,000 employees (and a platform!).

Here is the full list of stories that we covered in this week’s show:

Climate

Renewables

Big Data

Mobile

Apps

Internet of Things

Comms

Wearables

Cognitive Computing

Misc

post

Ubiquitous computing, the Internet of Things, and the discovery of sound

Sounds of East Lansing photo

I had a really interesting, wide-ranging, conversation with SalesForce’s VP for Strategic Research, Peter Coffee the other day.

A lot of our conversation revolved around how recent changes in the Internet of Things space, in ubiquitous computing, and in Big Data and analytics area are enabling profound effects on how we interact with the world.

Peter had a superb analogy – that of sound travelling through air. When sound is generated, it is transmitted from the source to the surrounding air particles, which vibrate or collide and pass the sound energy along to our ears. Without any air particles to vibrate, we wouldn’t hear the sound (hence there is no sound in space).

As you enter our planet’s atmosphere from space you start to encounter molecules of air. The more molecules there are, the better they can interact and the more likely they are to transmit sound.

If you hadn’t experienced air before, you might not be aware of the existence of sound. It is unlikely you would even predict that there would be such a thing as sound.

In a similar way, in the late eighties, when very few people had mobile phones, it would have been nigh on impossible to predict the emergence of the mobile computing platforms we’re seeing now, and the advances they’ve brought to things like health, education and access to markets (and cat videos!).

And, we are just at the beginning of another period when massive change will be enabled. This time by pervasive connectivity. And not just the universal connectivity of people which mobile phones has enabled, but the connectivity of literally everything that is being created by low cost sensors and the Internet of Things.

We are already seeing massive data streams now coming from expensive pieces of equipment such as commercial jets, trains, and even wind turbines.

But with the drastic fall in the price of the technologies, devices such as cars, light bulbs, even toothbrushes that were never previously, are now being instrumented and connected to the Internet.

This proliferation of (typically cloud) connected devices will allow for massive shifts in our ability to generate, analyse, and act on, data sets that we just didn’t have before now.

When we look at the concept of the connected home, for example. Back in 2009 when we in GreenMonk were espousing the Electricity 2.0 vision, many of the technologies to make it happen, hadn’t even been invented. Now, however, not only are our devices at home increasingly becoming connected, but technology providers like Apple, Google, and Samsung are creating platforms to allow us better manage all our connected devices. The GreenMonk Electricity 2.0 vision is now a lot closer to becoming reality.

We are also starting to see the beginnings of what will be seismic upheavals in the areas of health, education, and transportation.

No-one knows for sure what the next few years will bring, but it is sure going to be an exciting ride as we metaphorically discover sound, again and again, and again.

Photo credit Matt Katzenberger

post

Here comes the sun… IBM and solar forecasting

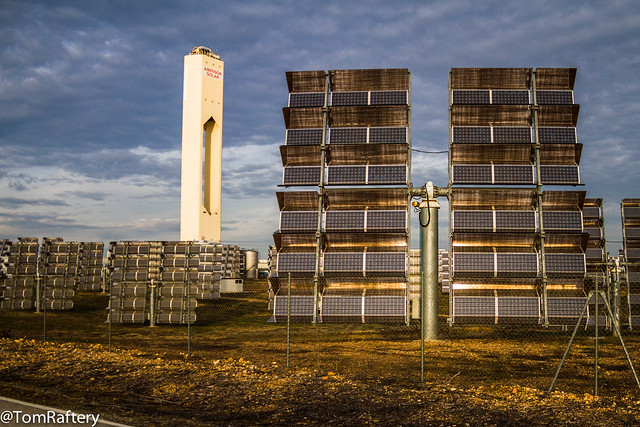
Concentrating solar power array

For decades now electricity grids have been architected in the same way with large centralised generation facilities pumping out electricity to large numbers of distributed consumers. Generation has been controlled, and predictable. This model is breaking down fast.

In the last decade we have seen a massive upsurge in the amount of renewable generation making its way onto the grid. Most of this new renewable generation is coming from wind and solar. Just last year (2013), almost a third of all newly added electricity generation in the US came from solar. That’s an unprecedented number which points to a rapid move away from the old order.

This raises big challenges for the grid operators and utilities. Now they are moving to a situation where generation is variable and not very predictable. And demand is also variable and only somewhat predictable. In a situation where supply and demand are both variable, grid stability can be an issue.

To counter this, a number of strategies are being looked at including demand response (managing the demand so it more closely mirrors the supply), storage (where excess generation is stored as heat, or potential energy, and released once generation drops and/or demand increases), and better forecasting of the generation from variable suppliers.

Some of the more successful work being done on forecasting generation from renewables is being undertaken by Dr Hendrik Hamann at IBM’s TJ Watson Research Center, in New York. Specifically Dr Hamann is looking at improving the accuracy of forecasting solar power generation. Solar is extremely complex to forecast because factors such as cloud cover, cloud opacity and wind have to be taken into account.
IBM Solar Forecaster
Dr Hamann uses a deep machine learning approach to tackle the many petabytes of big data generated by satellite images, ground observations, and solar databases. The results have been enviable apparently. According to Dr. Hamann, solar forecast accuracy using this approach is 50% more accurate than the next best forecasting model. And the same approach can be used to predict rainfall, surface temperature, and wind. In the case of wind, the forecast accuracy is 35% better than the next best model.

This is still very much a research project so there is no timeline yet on when (or even if) this will become a product, but if it does, I can see it being an extremely valuable tool for solar farm operators (to avoid fines for over-production, for example), for utilities to plan power purchases, and for grid management companies for grid stability purposes.

The fact that it is a cloud delivered (pun intended, sorry) solution would mean that if IBM brings it to market it will have a reduced cost and time to delivery, bringing it potentially within reach of smaller operators. And with the increase in the number of solar operators (140,000 individual solar installations in the U.S. in 2013) on the grid, highly accurate forecasting is becoming more important by the day.

post

Microsoft, big data and smarter buildings

Smarter building dashboard

If you checked out the New York Times Snow Fall site (the story of the Avalanche at Tunnel Creek), then Microsoft’s new 88 Acres site will look familiar. If you haven’t seen the Snow Fall site then go check it out, it is a beautiful and sensitive telling of a tragic story. You won’t regret the few minutes you spend viewing it.

Microsoft’s 88 Acres is an obvious homage to that site, except that it tells a good news story, thankfully, and tells it well. It is the story of how Microsoft is turning its 125-building Redmond HQ into a smart corporate campus.

Microsoft’s campus had been built over several decades with little thought given to integrating the building management systems there. When Darrell Smith, Microsoft’s director of facilities and energy joined the company in 2008, he priced a ‘rip and replace’ option to get the disparate systems talking to each other but when it came in at in excess of $60m, he decided they needed to brew their own. And that’s just what they did.

Using Microsoft’s own software they built a system capable of taking in the data from the over 30,000 sensors throughout the campus and detecting and reporting on anomalies. They first piloted the solution on 13 buildings on the campus and as they explain on the 88 Acres site:

In one building garage, exhaust fans had been mistakenly left on for a year (to the tune of $66,000 of wasted energy). Within moments of coming online, the smart buildings solution sniffed out this fault and the problem was corrected.
In another building, the software informed engineers about a pressurization issue in a chilled water system. The problem took less than five minutes to fix, resulting in $12,000 of savings each year.
Those fixes were just the beginning.

The system balances factors like the cost of a fix, the money that will be saved by the fix, and the disruption a fix will have on employees. It then prioritises the issues it finds based on these factors.

Microsoft facilities engineer Jonathan Grove sums up how the new system changes his job “I used to spend 70 percent of my time gathering and compiling data and only about 30 percent of my time doing engineering,” Grove says. “Our smart buildings work serves up data for me in easily consumable formats, so now I get to spend 95 percent of my time doing engineering, which is great.”

The facilities team are now dealing with enormous quantities of data. According to Microsoft, the 125 buildings contain 2,000,000 data points outputting around 500,000,000 data transactions every 24 hours. The charts, graphics and reports it produces leads to about 32,300 work orders being issued per quarter. And 48% of the faults found are corrected within 60 seconds. Microsoft forecasts energy savings of 6-10% per year, with an implementation payback of 18 months.

Because Microsoft’s smart building tool was built using off the shelf Microsoft technologies, it is now being productised and will be offered for sale. It joins a slew of other smarter building solutions currently on the market from the likes of IBM, Echelon, Cisco et al, but given this one is built with basic Microsoft technologies, it will be interesting to see where it comes in terms of pricing.

Price will certainly be one of the big deciding factors in any purchasing decision, any building management tool will need to repay it’s costs within at least 18 months to merit consideration. Functionality too will be one of the primary purchase filters and what is not clear at all, from the Microsoft report, is whether their solution can handle buildings on multiple sites or geographies. If I hear back either way from Microsoft on this, I will update this post.

This is a market that is really starting to take off. Navigant Research (formerly Pike Research) issued a report last year estimating the size of the smart building managed services market alone will grow from $291m in 2012 to $1.1bn by 2020. While IMS Research estimated the Americas market for integrated and intelligent building systems was be worth more than $24 billion in 2012.

One thing is for sure, given that buildings consume around 40% of our energy, any new entrant into the smarter buildings arena is to be welcomed.

Image credit nicadlr

post

Sustainability, social media and big data

The term Big Data is becoming the buzz word du jour in IT these days popping up everywhere, but with good reason – more and more data is being collected, curated and analysed today, than ever before.

Dick Costolo, CEO of Twitter announced last week that Twitter is now publishing 500 million tweets per day. Not alone is Twitter publishing them though, it is organising them and storing them in perpetuity. That’s a lot of storage, and 500 million tweets per day (and rising) is big data, no doubt.

And Facebook similarly announced that 2.5 billion content items are shared per day on its platform, and it records 2.7 billion Likes per day. Now that’s big data.

But for really big data, it is hard to beat the fact that CERN’s Large Hadron Collider creates 1 petabyte of information every second!

And this has what to do with Sustainability, I hear you ask.

Well, it is all about the information you can extract from that data – and there are some fascinating use cases starting to emerge.

A study published in the American Journal of Tropical Medicine and Hygiene found that Twitter was as accurate as official sources in tracking the cholera epidemic in Haiti in the wake of the deadly earthquake there. The big difference between Twitter as a predictor of this epidemic and the official sources is that Twitter was 2 weeks faster at predicting it. There’s a lot of good that can be done in crisis situations with a two week head start.

Another fascinating use case I came across is using social media as an early predictor of faults in automobiles. A social media monitoring tool developed by Virginia Tech’s Pamplin College of Business can provide car makers with an efficient way to discover and classify vehicle defects. Again, although at early stages of development yet, it shows promising results, and anything which can improve the safety of automobiles can have a very large impact (no pun!).

GE's Grid IQ Insight social media monitoring tool

GE have come up with another fascinating way to mine big data for good. Their Grid IQ Insight tool, slated for release next year, can mine social media for mentions of electrical outages. When those posts are geotagged (as many social media posts now are), utilities using Grid IQ Insight can get an early notification of an outage in its area. Clusters of mentions can help with confirmation and localisation. Photos or videos added of trees down, or (as in this photo) of a fire in a substation can help the utility decide which personnel and equipment to add to the truckroll to repair the fault. Speeding up the repair process and getting customers back on a working electricity grid once again can be critical in an age where so many of our devices rely on electricity to operate.

Finally, many companies are now using products like Radian6 (now re-branded as Salesforce Marketing Cloud) to actively monitor social media for mentions of their brand, so they can respond in a timely manner. Gatorade in the video above is one good example. So too are Dell. Dell have a Social Media Listening Command Centre which is staffed by 70 employees who listen for and respond to mentions of Dell products 24 hours a day in 11 languages (English, plus Japanese, Chinese, Portugese, Spanish, French, German, Norwegian, Danish, Swedish, and Korean). The sustainability angle of this story is that Dell took their learnings from setting up this command centre and used them to help the American Red Cross set up a similar command centre. Dell also contributed funding and equipment to help get his off the ground.

No doubt the Command Centre is proving itself invaluable to the American Red Cross this week mining big data to help people in need in the aftermath of Hurricane Sandy.