Search Results for: cloud

post

Sustainability, social media and big data

The term Big Data is becoming the buzz word du jour in IT these days popping up everywhere, but with good reason – more and more data is being collected, curated and analysed today, than ever before.

Dick Costolo, CEO of Twitter announced last week that Twitter is now publishing 500 million tweets per day. Not alone is Twitter publishing them though, it is organising them and storing them in perpetuity. That’s a lot of storage, and 500 million tweets per day (and rising) is big data, no doubt.

And Facebook similarly announced that 2.5 billion content items are shared per day on its platform, and it records 2.7 billion Likes per day. Now that’s big data.

But for really big data, it is hard to beat the fact that CERN’s Large Hadron Collider creates 1 petabyte of information every second!

And this has what to do with Sustainability, I hear you ask.

Well, it is all about the information you can extract from that data – and there are some fascinating use cases starting to emerge.

A study published in the American Journal of Tropical Medicine and Hygiene found that Twitter was as accurate as official sources in tracking the cholera epidemic in Haiti in the wake of the deadly earthquake there. The big difference between Twitter as a predictor of this epidemic and the official sources is that Twitter was 2 weeks faster at predicting it. There’s a lot of good that can be done in crisis situations with a two week head start.

Another fascinating use case I came across is using social media as an early predictor of faults in automobiles. A social media monitoring tool developed by Virginia Tech’s Pamplin College of Business can provide car makers with an efficient way to discover and classify vehicle defects. Again, although at early stages of development yet, it shows promising results, and anything which can improve the safety of automobiles can have a very large impact (no pun!).

GE's Grid IQ Insight social media monitoring tool

GE have come up with another fascinating way to mine big data for good. Their Grid IQ Insight tool, slated for release next year, can mine social media for mentions of electrical outages. When those posts are geotagged (as many social media posts now are), utilities using Grid IQ Insight can get an early notification of an outage in its area. Clusters of mentions can help with confirmation and localisation. Photos or videos added of trees down, or (as in this photo) of a fire in a substation can help the utility decide which personnel and equipment to add to the truckroll to repair the fault. Speeding up the repair process and getting customers back on a working electricity grid once again can be critical in an age where so many of our devices rely on electricity to operate.

Finally, many companies are now using products like Radian6 (now re-branded as Salesforce Marketing Cloud) to actively monitor social media for mentions of their brand, so they can respond in a timely manner. Gatorade in the video above is one good example. So too are Dell. Dell have a Social Media Listening Command Centre which is staffed by 70 employees who listen for and respond to mentions of Dell products 24 hours a day in 11 languages (English, plus Japanese, Chinese, Portugese, Spanish, French, German, Norwegian, Danish, Swedish, and Korean). The sustainability angle of this story is that Dell took their learnings from setting up this command centre and used them to help the American Red Cross set up a similar command centre. Dell also contributed funding and equipment to help get his off the ground.

No doubt the Command Centre is proving itself invaluable to the American Red Cross this week mining big data to help people in need in the aftermath of Hurricane Sandy.

post

GreenMonk TV Moderated Sustainability ScreenCast on Operational Risk Management with SAP’s Jeremiah Stone

As a new product for clients, GreenMonk are now offering moderated screencast videos – the inaugural one is with SAP’s VP of Sustainability Solutions, Jeremiah Stone. In this screencast Jeremiah and I discuss Operational Risk Management, what that has to do with sustainability, how SAP are moving from systems of record to systems of engagement, and seven minutes into the video, Jeremiah gets out his iPhone and iPad and gives a really cool demo of how their software can be used in the field.

Here’s the transcription of the screencast:

Tom Raftery: Hi everyone, welcome to GreenMonk TV. We are doing a moderated screen cast with Jeremiah Stone from SAP.

Jeremiah is VP, Sustainability Solutions. So today we are going to talking about operational risk management. Jeremiah could you first of all give me a quick intro on why you think operational risk management has anything to do with sustainability?

Jeremiah Stone: Hi Tom good morning. Thank you for having me on GreenMonk. I am a big follower and I like what you guys do. So it’s really a lot of fun for me to come on with you.

When SAP has worked with our customers, and we have a customer base in manufacturing of close to 30,000 customers, the common thing that comes back to us is that companies are engaged and interested in running more sustainably and that means using less energy, it means producing less emissions. It means recruiting people for the long term and making sure that they can adapt to changing labor conditions and changing demographics.

But there are sorta some prerequisites before people or companies can be successful with that and one of those is to cut operational losses and also to be able to adapt and change within their operations because often these factories, these plants, these operations are sort of steady state designed entities where they are very static and they are not really amenable to change.

Tom Raftery: What kind of operational losses you are referring to Jeremiah?

Jeremiah Stone: Well Tom it’s easy to think about the types of catastrophic accidents that happen throughout the world I think the Gulf oil spill is something that people think off, Bhopal thirty plus years on is still high in people’s minds. So those sorts of process safety incidents, we regrettably had a fire here in the California Bay Area not two weeks ago up at the Richmond Refinery.

These things happens, sort of, every day and what we are seeing is that as manufacturing operations and manufacturing I think of oil and gas, I think of utilities, I think of mining, but even transportation logistics air planes that sort of thing. We’ve built these systems that are very complex and sophisticated but they are not very change friendly.

So, to change them, they need to change, they need a radical change for sustainability purposes they need to have systems in place whereby you can change and continuously improve the static designed system whether it’s an energy refinery or a transportation network without having accidents, without hurting people, without creating environmental spills, et cetera. And we find that our customers are fundamentally lacking that ability.

Tom Raftery: Okay, tell me something so about or — tell me about this operational risk management solution that SAP have.

Jeremiah Stone: Okay, well maybe first we can start with what we just talked about and saying that what our customers are asking us for.

Our customers are asking us to help them innovate their operations and become more sustainable and really what that has boiled down to when you dig into it with customers is that they typically have environment health and safety management programs.

However, they really run at an individual operational entity level and so it is difficult to compare different factories, it’s difficult to compare different operations, and it’s very difficult to get proactive and move beyond very reactive, “oh no an incident happened how do we deal with that?” setting. But rather identifying risk before it turns into an incident and dealing with it.

You cannot remove risk from these operations but you can manage them. And that’s really what our customers are asking us for. And when we — we’ve gone out and we’ve worked with I think close to 50 co-innovation customers now and working with means going with our teams into their operations interviewing people throughout the company and determining what the problems are and where software can help.

What we found consistently is that it’s an information flow problem. It’s an information flow from the corporate level where the purse strings are, the ability to spend money down to the individual level and some of the problems we find is that there is a really strong and meaningful commitment to safety at the corporate level in the boardroom, however it’s very difficult to understand where to spend the money, because you have this very large sophisticated operations and it’s difficult to know where to make the investment and getting beyond a better laminated sign on the chain link fence outside the operation is tough.

And then when you get to the operational level oh gosh, every — these days margins are razor thin, the current economic situation most of your line level management or leaders are really focused on hitting outcomes, hitting on, hitting their targets. And they may be in a position to make bad decisions, here we say can we put in a bigger pump to increase production, well if you put in a bigger pump how do you know that in your, in your facility that’s not going to burst a seal somewhere?

That’s really standard process safety management, but doing that in a consistent repeatable way successfully is rather difficult and then at the individual worker level understanding the operational environment in knowing how to behave, take the right processes, be safe is a challenge, but we are completely missing the inbound engagement conduit if you will, when they see something wrong how can one, an individual worker if they see something wrong report that.

All to often, when there is a problem and we do an investigation after an incident, well gosh the workers who are in that environment knew that there was something wrong, they didn’t have a means to communicate.

Tom Raftery: Okay, so how do you fix that?

Jeremiah Stone: Well there is a lot of discussion these days in the enterprise software community moving from systems of record to systems of engagement and this is something we focused quite a bit on and I like to show you a couple of applications right now where we are taking what would be a typical approach to a system of record to identifying a risk, which would be sort of one of SAP’s typical enterprise applications at a specialist enterprise health and — environment health and safety management professional level and moving that both directions.

And so if we look at this you could imagine that you are going to have your EHS professionals that are site level managers but they are the only ones that really have that information today and they don’t have a means by which they can push that information up to corporate nor do they have a means where they can gather at large scale that information from the workers.

And what I’d like to do is that I’d like to show you how we are addressing that today in terms of a mobile application. So I am going to share with you now my iPhone. Hopefully this, comes through, can you see my iPhone?

Tom Raftery: Yep.

Jeremiah Stone: Okay, so what I’d like to do is I’d like to show you our safety issue application. Our safety issue application, let me back out of here, this is the entire application and so we are trying to really take a note out of consumer design and have one screen application without lots of tabs and drill through menus. And we have designed this application around the, “if you see something, say something” design principle and actually John Astill one of the mentors has worked on this app, that’s part of his sustainability activities.

And I’ve got a example here, I raided my son’s toy chest this morning, and just to give you an example here. You can imagine here is our little repairman out in the setting. And he notices there is something wrong with this hauler. Rather than walking all the way back to the shop, he can simply take a picture of what’s wrong with the hauler. He can say okay, I am going to use that photo, he can press the record button here and record description of what’s wrong, I am not going hit that record button because then you loose the screencast. Maybe enter quick description here, “Axle wearing too quickly on hauler,” accept that description and then simply submit the safety issue.

And so you can see there that in a few seconds we have gone from seeing something wrong, recording a description with audio and then and then sending that off to the safety experts and this is uploading like it would to YouTube or anything else. And what you haven’t seen me do is enter my name, or enter where I was, or any of those such things because we are using location based services, we are using the enterprise backbone to say who saw the thing that was wrong, where are they, et cetera.

And because we also have the entire asset infrastructure in the background, we can similarly then say, oh well actually we know which truck that was, because we have near field communications et cetera. So that’s how you get more information into the system.

Tom Raftery: But nobody ever reads these reports, do they?

Jeremiah Stone: That’s an interesting point. Now imagine you are in this world where you drop the hey I saw something wrong into the box on the wall or you submit that paper issue, how do you know what happened if you were the person that reported that. I am glad you asked that because as you can see here we have the ability to capture the safety issue, but we also have this button here that says my issues.

So if I click into that my issues what’s it’s going to do is it’s going to look for every issue that I have submitted. And I can drill in, and I can see the real time status on that issue and if it’s being worked on or not. So now I am creating mutual accountability with the safety organization, you say nobody every reads that, well guess what, you would actually know if anybody had ever, ever read it, because we are tied into the core SAP system in the background.

And now there has been a workflow sent to the responsible safety mentor and we are are using that enterprise backbone now to facilitate communication.

So, now, rather than dropping that paper form off or submitting a form, it just goes into somebody’s inbox, now we are using much, much the same in any kind of social media. We are using mobility and social media now to push that information to the responsible safety person and along with a GPS of where we are, okay it’s not picking up, but well I think I must be in my Faraday shielded office here. But, this would then be picking up my my GPS, it would also be passing out through to the application. So now the safety manager and the employee have a relationship driven by the application.

Tom Raftery: But now the safety manager has gone from receiving one notification every three months to receiving 300 everyday.

Jeremiah Stone: That’s correct.

Tom Raftery: How does he work with that or she?

Jeremiah Stone: Well I’m not going to drill into that right now, but that’s the thing we’ve always been really good at, at SAP is how to deal with the large volumes of data. And so we have the ability to sort, slice and dice this information coming in, we have heavy duty analytics to show trending, to hot spot on the basis of the information put in. We also have as you see here this little flag, immediate action required, yes or no to help to raise it or lower the priority.

And our safety manager tells us hey that’s okay, my problem in the past was really a lack of data, not too much data and I want more data. There is a well known, in the industr,y sort of a ratio between near misses to incidents, its about 300 to 1, about 300 observations or near misses to an individual incident. And if you actually go into the day to day — any of these companies and they say, oh you know, we had 100 reportable incidents but we had 6,000 reported near misses.

Well they are usually quarter, a couple of orders of magnitude off between an observation or near miss and an actual incident. And so these professionals actually want more data not less.

Tom Raftery: Cool.

Jeremiah Stone: And we give them the tools to deal with that data, but now I’m going to show you how we expose that data to people who aren’t used to dealing with that data and that’s that upper level of management that I talked about before.

So that upper level of management, who is not giving any data at all, if we were to throw 300 observations at them per day, they wouldn’t have any idea what to do with it. But if we take those people who are good at dealing with the area and we expose the output of their analysis to upper management in a mobile device as you see here in a way that they can consume it, we can get better investments.

So what you’re seeing now is incident root causes and so somebody would have entered a safety observation with the iPhone app on the left and then there is a safety professional in between who has processed that, done an investigation, identified root causes.

Now we have the ability, let’s say your upper management are rather visual learners, I can drill in here to a word cloud and rather than looking at this with boxes and rows et cetera, we can expose the root causes to management or other users, let’s say you’ve got people coming into the organization now that are not used to looking at spreadsheets their whole life but they are used looking at Tag clouds or something that you get online and we can give them their information in a way they can consume it.

And so here we can see okay we’ve got a training problem, but let’s just say for the sake of argument that we’ve got a non-millennial here looking for the root causes and they want to look at a pie graph and then they want to say okay well I understand the root cause, but I understand what injuries have been happening.

So I’m going to add another dimension here, so now I’ve taken my route causes along the bottom here; defective equipment, lack of training, we still see that spike on lack of training that we saw before but now we’ve added that body part that’s been injured and now I’m just going to sort by occurrences.

So now we can see we’ve got a — main root cause is lack of training and we have arm injuries. And so the probability here is that we’ve got new equipment, we can dig a little bit further, we probably have new equipment in the setting and people are getting hurt by that.

We talk about environmental spills, we talk about explosions but big problem with sustainability is it’s also how you’re treating your labor force and the long-term consequences of what we maybe perceiving as smaller incidents, but let me tell you if you lose a finger, you lose an arm that’s a catastrophic incident to you as a worker.

So, we want to be able to help with that as well, and also from an employer point of view, your long-term liabilities with regard to workers compensation, et cetera, and what’s great about this app is we know that managers work in primary in email, well I can now send this to let’s say my safety manager, update training and go ahead and send that off and I can go ahead and you know I’m really amazed I should have you in there.

Well and anyway I can send that off to you Raftery at Greenmonk or whatever and then what this would give you is all of the data but also that graphic and say okay let’s look at this data I’m looking at, let’s work on this together.

So we’re really trying to move from what would have been a system of record approach to safety and risk, to a system of engagement approach by pushing out the ability to identify risks, here we can see we can take a picture there, the ability to identify risks in the operational setting and also the ability to understand what those risks are and take action at the management level.

Tom Raftery: And what kinds of industries would typically be interested in solutions like this?

Jeremiah Stone: So that the types of industries we tend to work with in solutions like this tend to be what we refer to as asset intensity industries, so these are industries that have lots of trucks, planes and also large equipment and they are high risk. So you typically think of oil and gas, both upstream on the exploration and production side and downstream on the refining side.

Also think of any type of large construction, so we’re staying in the energy field here, you could do a thing of utilities, what some people refer to as large construction companies with generation capacity. And anybody who is going to be putting up say a windmill farm or solar, et cetera, it’s going to be a same challenge here in terms of people in it and with lots of stuffs moving in, lots of heavy machinery, mining, mill, production.

I mentioned utilities, that also would include utilities like phone, et cetera and then transportation logistics, think of your airlines, US, FedEx, US Post that sort of thing. There is definitely a large demand in those types of industries for this, because they are large far flung organizations where training is a big deal, they are very fast moving and risk is also a big deal and so you see the potential to have major issues there.

Tom Raftery: And what about the current economic climate, is that impacting on sales?

Jeremiah Stone: I’d say it’s driving sales even more quickly. We’re seeing in this portfolio about a 35% compound annual growth rate over the last three years since the crisis onward, and that’s because companies are becoming even more loss averse in the current environment.

So it works both ways, when you’re trying to grow and you are investing you don’t want to have incidents because you want to be fast and agile to market, but also when you’re concerned about potential production stoppages or issues with regards to your liability, say an environmental spill or people spill or people incident, you want to control that as well, and so it’s really a cycle proof investment area in that sense, because it’s both something you need when you’re growing quickly and investing and something when you are at more of a steady state and you’re looking to control loss.

Tom Raftery: We are coming on time to wrap up now, just one last thing, where do you see things going from here?

Jeremiah Stone: Well what we’ve done today is we’ve taken our portfolio as we have it and as I mentioned we have these base capabilities in your incident management risk assessments, workers safety management, management changed and we’ve moved these into more systems of engagement at both the individual worker level and the corporate level.

Where I believe we are is we barely built the foundation for what we can do here, and the next step will be utilizing our abilities to deal with big real time data and so not just having the intelligent sensor of the human pushing data in, but imagine the internet of things pushing information into a system like this and then imagine taking predictive analytics and start to not only identify a risk when we see it from a professional point of view but now put algorithms at that.

Let’s point R at that from a particular algorithm point of view and start to identify latent and hidden risk in our operations. We can have predictive safety as well and then just have to utilize our assets as well in the cloud, so for example the recent success factors, acquisition, you’ll notice something that you don’t see on the screen here is training, qualifications, ongoing learning, informal learning via collaboration.

The true moving the system engagement, we should be utilizing Jam here from SAP to help grow communities of practice and communities of expertise around safety across companies and across even value chains and we’re starting to see that as well, so I think we’ve really barely taken the first step with what we can do here.

Tom Raftery: Well, fascinating. Jeremiah that’s been great. Thanks a million for talking to us today.

Jeremiah Stone: Thank you so much Tom. Bye, bye.

post

SAP’s Sustainability announcements at Sapphire Now

SAP co-CEO Jim Hagemann Snabe at Sapphire Now 2012

SAP co-CEO Jim Hagemann Snabe at Sapphire Now 2012

Technology innovation plays a major part in creating a sustainable world tomorrow

So said SAP co-CEO Jim Hagemann Snabe at this year’s SAP Sapphire Now conference in Orlando. He then went on to predict three major trends in computing for the coming years – according to Jim, in the next five years everything will move to Cloud, everything will be in main memory and everything will be mobile.

This wasn’t just some off-the-cuff remark – these three developments are core to SAP’s product roadmap – even in the Sustainability space.

In the mobile space for example, at Sapphire Now SAP announced a new version of a mobile app for incident management. With this app, workers can now log issues from their mobile device with a photo or video, as well as an audio recording, and send it directly to an incident or safety manager for corrective action. This crowd-sourcing of safety information also has built-in tracking of the reported incident which is hugely empowering for workers who may previously have felt their voice wasn’t heard. And for the companies deploying this solution it leads to a safer work environment and a happier workforce.

This puts me in mind of an initiative IBM rolled out with the Los Angeles Unified School District (LAUSD) where they enabled students, teachers and staff to report issues like water leaks, broken aircon/heating, exposed cables and so on, by sending text messages and photos through their mobile phones. More please.

Also in the mobile sustainability space, SAP have their Electronic Medical Record app [SilverLight warning] – an app which gives doctors instant access to a patient’s electronic medical records.

In the Cloud space, SAP have made two major recent acquisitions – Successfactors and more recently Ariba at a cost of roughly $7.7bn. This is a clear indicator that while SAP maybe late to the party, it is serious about catching up.

And in the Sustainability space? Well SAP’s carbon management software, Carbon Impact OnDemand is already Cloud delivered. At SapphireNow SAP announced that they are going to rollout an on-demand service for product safety that the company is calling the SAP Product Stewardship and Safety Network. This will be a network where safety professionals can share safety information and best practices.

The irony of sustainability-related software being delivered via the Cloud, a technology which is not Green at all, is not lost on me. It does appear to be lost on SAP however – more on which in a follow-up post.

And finally in-memory computing – what is it? Well, you know how information held in RAM is much faster to access than information on disk, right? So HANA, SAP’s new in-memory database, is where the database is held in RAM for much faster data access. Also, in-memory databases can hold enormous quantities of data, and query them in milliseconds. This is a huge step forward in database technologies and according to SAP it will vastly simplify database maintenance as well because there should no longer be a need for large data warehouses.

Where do the HANA and Sustainability stories intersect? There are several examples – the first is in the area of Smart Grids and Smart meters. The volumes of information utility companies will be expected to handle after installing smart meters are orders of magnitude greater than anything they are used to. Realtime analysis of this firehose of information will allow for much better demand-side management, matching the demand curve to the supply curve, stabilising the grid and allowing for greater penetration of variable generators like wind and solar. Also, this availability of highly granular energy consumption data will facilitate the development of all kinds of new energy products and services that would have previously been impossible to offer. This is sorely needed by utilities who are in the uncomfortable position of currently (no pun) having to try to convince customers to buy less of their product.

Other use interesting cases are discussed in a great post on How Big Data Will Help Achieve Sustainability Goals by SAP’s Scott Bolick. And when you finish checking that out, head on over to Jennifer Lankheim’s post on SAP Situational Awareness for Public Sector where she discusses this new SAP Rapid Deployment Solution to help public safety and security organizations better anticipate, assess, and act on emergency situations.

We are only scratching the surface of what the implications of Big Data, Cloud, Mobility and in-memory computing are for sustainability. Expect to see far more announcements in this space in the near future.

Disclosure – SAP is a GreenMonk client and SAP paid my travel and expenses to attend Sapphire Now.

Photo Credit Tom Raftery

post

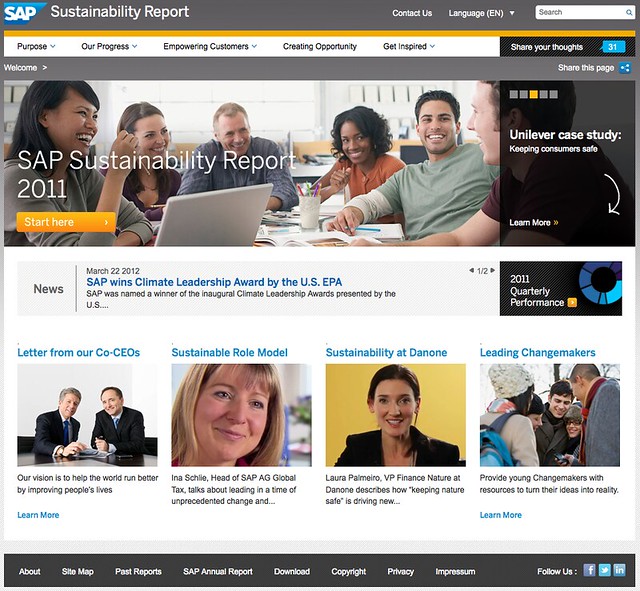
SAP’s 2011 Sustainability Report

SAP 2011 Sustainability Report

SAP launched its 2011 Sustainability Report this week and in terms of aesthetics and social sharing, this is one of the best Sustainability Reports I have seen to-date.

The site contains many videos with SAP staff – including one from co-CEO’s Jim Hagemann Snabe & Bill McDermott which is featured prominently on the home page. Interestingly there are also several customer reference videos as well with the customers vouching for how SAP have helped them become more sustainable.

There are also many blog posts and interesting stories from SAP employees talking about everything from Materiality, through to Electric Vehicles.

There is a whole section in the report dedicated to how SAP Empowers its customers. It includes customer video testimonials, white papers and some very impressive top line figures for savings (“5.7 million tons of estimated carbon reductions, saving $550 million in energy costs”). However the methodology for producing these data is not gone into in any detail in this section. I contacted SAP to voice my concerns about this and they assured me that in the next couple of weeks the report will be updated to include the methodologies, and the story around producing this innovative section of the report.

SAP's progress on sustainability

As you’d expect from SAP, there’s also a lot of data in the report on how they are doing on their journey to sustainability and it’s mostly positive results. Almost all of their numbers are headed in the right direction. Unfortunately the exceptions to this are in the environmental area with increases in Data Centre Energy, Total Energy consumed and SAP’s Greenhouse Gas Footprint.

On the data centre energy front, the energy increase is both in real terms, and in kWh per employee. This is likely due to SAP increasingly hosting customers data and applications through their cloud offerings. What might be interesting here would be to see a kWh per cloud customer metric, or similar. Also, one would suspect that there should be a net reduction in energy consumption for that application, if it is replacing a customer’s pre-existing on-premises application. There could be some interesting data to mine there around energy wins.

On the Total Energy Consumed page you see that energy consumption has increased from 843GWh in 2010 to 860GWh in 2011. In the report it attributes this to growth in the business (SAP bought SucessFactors during this period) but the lack of a kWh per Employee metric on this page makes this hard to verify.

On the Greenhouse Gas page, we again see an increase in emissions from the 453kTons 2010 figure to 490kTons in 2011. On this page, it is possible to see a By Employee figure and here too we see an increase in emissions from 8.7 tons per employee in 2010 to 9.0 tons in 2011. However, when we look at the emissions by ? revenue, we see a fall, from 36.3g/? in 2010 to 34.4g/? in 2011. 2011 was a good year for SAP, from a revenue perspective, it would appear.

On the upside, SAP has increased its use of renewable energy from 45% to 47%. Not a huge increase, to be sure, but at least this environmental metric is going in the right direction.

I mentioned that the site has a lot of social sharing built into it – there’s a “Share this page” on every page which allows you to share that page on your social network of choice (or print, or email!). However, in terms of interactivity, the report seems to have regressed. In the 2010 report, there was the ability to comment directly on any page, to rate comments, and see conversations taking place about the page, directly on the page. This functionality has been removed completely from the 2011 report, and to be honest, the report is the poorer for its removal. Browsing other readers comments on pages is always a superb way to gain others insights into the page content – both for consumers of the report, as well as for SAP.

From a UI perspective there are several glitches on the site (some rollovers not working; external links and links to PDF’s not made obvious; and inconsistent use of pretty permalinks etc.) but these are minor quibbles and easily fixed.

The 2010 report doubled individual visitors over the 2009 report, with the 2010 report receiving over 60,000 readers. SAP tell me they are aiming to maintain that progress and have over 120,000 visitors to this, the 2011 report. One huge advantage of having the report in the form of a website, is of course the invaluable data stream you receive from the visitor analytics to the report. Something which is impossible to achieve with a PDF.

On the whole, SAP’s 2011 report, with the removal of the interactivity and the increased energy and emissions, seems to have faltered slightly in terms of the tremendous progress it had been making to-date. To put that in perspective, SAP’s 2011 report is still one of the better produced sustainability reports.

For the 2011 report I’ll have to grade it as “very good, but could do better”.

Photo Credit Tom Raftery

post

CarbonSystems EPS chosen by Microsoft for its global environmental reporting

Microsoft

In my reviews of tech companies sustainability reporting, one very obvious laggard has always been Microsoft. Hopefully that’s all about to change.

Why? Microsoft has just signed up with CarbonSystems to use CarbonSystems cloud-delivered Enterprise Sustainability Platform (ESP) to manage its energy efficiency initiatives and for reporting its environmental performance globally.

This is big news. Microsoft has 600 facilities across 110 countries worldwide. For the first time, the full energy and environmental footprints of all these sites will now be managed from within a single cloud-delivered resource, the CarbonSystems ESP system. The levels of transparency this will give Microsoft will be immense. Perhaps now, unlike many of its competitors, Microsoft will be able to join the EU’s ICT Footprint initiative.

This move should also enable Microsoft to report on the energy and emissions associated with its own cloud infrastructure – something, like all other cloud providers, Microsoft has failed to do to-date.

This move is a big deal for CarbonSystems too. CarbonSystems are an Australian company and have done quite well there but have more recently been eying the EU and US markets. Being selected by Microsoft for a global rollout has suddenly catapulted them up the credibility charts. Had you asked me previously which 3rd party platform Microsoft might have chosen I’d probably have mentioned SAP, Hara, CA, or Enablon.

Now with this win, CarbonSystems too has a seat at the big boys’ table.

Photo Credit ToddABishop

post

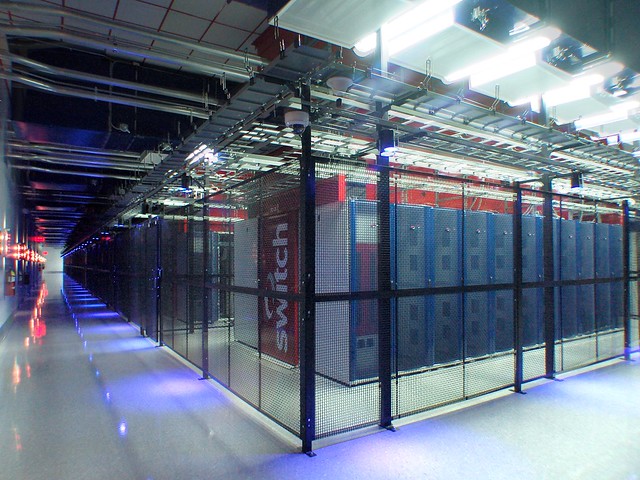
The Switch SuperNAP data centre – one of the most impressive I’ve been in

Switch SuperNAP data centre

If you were going to build one of the world’s largest data centre’s you wouldn’t intuitively site it in the middle of the Nevada desert but that’s where Switch sited their SuperNAPs campus. I went on a tour of the data centre recently when in Las Vegas for IBM’s Pulse 2012 event.

The data centre is impressive. And I’ve been in a lot of data centre’s (I’ve even co-founded and been part of the design team of one in Ireland).

The first thing which strikes you when visiting the SuperNAP is just how seriously they take their security. They have outlined their various security layers in some detail on their website but nothing prepares you for the reality of it. As a simple example, throughout our entire guided tour of the data centre floor space we were followed by one of Switch’s armed security officers!

The data centre itself is just over 400,000 sq ft in size with plenty of room within the campus to build out two or three more similarly sized data centres should the need arise. And although the data centre is one of the world’s largest, at 1,500 Watts per square foot it is also quite dense as well. This facilitates racks of 25kW and during the tour we were shown cages containing 40 x 25kW racks which were being handled with apparent ease by Switch’s custom cooling infrastructure.

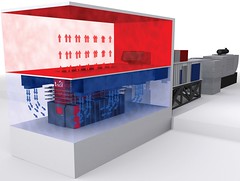
Switch custom cooling infrastructure

Because SuperNAP wanted to build out a large scale dense data centre, they had to custom design their own cooling infrastructure. They use a hot aisle containment system with the cold air coming in from overhead and the hot air drawn out through the top of the contained aisles.

The first immediate implication of this is that there are no raised floors required in this facility. It also means that walking around the data centre, you are walking in the data centre’s cold aisle. And as part of the design of the facility, the t-scif’s (thermal seperate compartment in facility – heat containment structures) are where the contained hot aisle’s air is extracted and the external TSC600 quad process chillers systems generate the cold air externally for delivery to the data floor. This form of design means that there is no need for any water piping within the data room which is a nice feature.

Through an accident of history (involving Enron!) the SuperNAP is arguably the best connected data centre in the world, a fact they can use to the advantage of their clients when negotiating connectivity pricing. And consequently, connectivity in the SuperNAP is some of the cheapest available.

As a result of all this, the vast majority of enterprise cloud computing providers have a base in the SuperNAP. As is the 56 petabyte ebay hadoop cluster – yes, 56 petabyte!

US electricity generation

Given that I have regularly bemoaned cloud computing’s increasing energy and carbon footprint on this blog, you won’t be surprised to know that one of my first questions to Switch was about their energy provider, NV Energy.

According to NV Energy’s 2010 Sustainability Report [PDF] coal makes up 21% of the generation mix and gas accounts for another 63.3%. While 84% electricity generation from fossil fuels sounds high, the 21% figure for coal is low by US standards, as the graph on the right details.

Still, it is a long way off the 100% of electricity from renewables that Verne Global’s new data centre has.

Apart from the power generation profile, which in fairness to Switch, is outside their control (and could be considerably worse) the SuperNAP is, by far, the most impressive data centre I have ever been in.

Photo Credit Switch

post

Using Mobile Endpoint Management to prolong smartphone battery life?

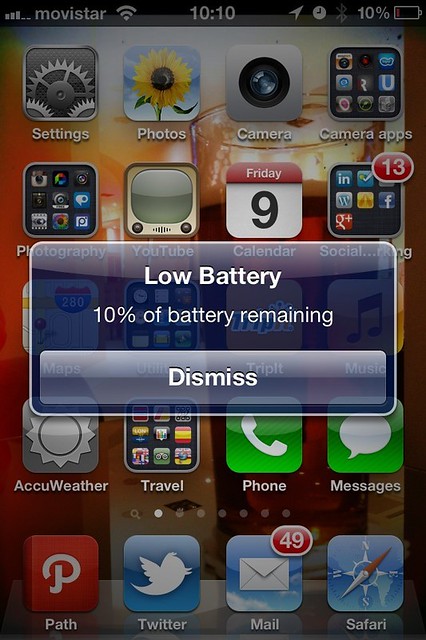
Low Battery Warning

Endpoint management is a term I came across relatively recently at a Symantec event – it refers to software used to manage client computers, laptops, and servers in an organisation (the endpoints of the network). Endpoint management software does things like automating the rollout of updates, manages licensing of software and often has a role in energy management of computers (ensuring they are shut down at the end of the day, not consuming resources when not in use). Also, policies can be set to ensure the power management of the machines doesn’t interfere with the installation of any patches.

With the increasing numbers of smartphones and tablets entering the workplace, a new class of enterprise software is appearing, mobile endpoint management. I’ve had discussions with Symantec about this last year and had a demo of IBM’s beta Mobile Endpoint Manager at this year’s IBM Pulse.

The IBM software, while not yet released, is still quite interesting. It has a considerable amount of functionality for securing devices and their data, as well as what IBM are calling micro-vpn – a nifty little bit of coding which allows for the ability to VPN from within an individual app on the mobile device.

One obvious trick that’s being missed though? Energy management for mobile devices.

The one issue that all smart phone owners share is battery life. This is also an issue for organisations which provide smartphones to their staff because many of those employees will charge their phones while at work, increasing the organisations’ energy and carbon footprints. Potentially worse though, is if the battery does run out, the staff member in question is harder to contact and may be cut off from company resources.

How do you, through software, extend the life of a smartphone battery?

Well, off the top of my head, a few things come to mind – how about scanning for services not being used and shutting them down (bluetooth, wi-fi, even 3G if battery life becomes critical). Also, applications not being used could be automatically force-quit so they aren’t consuming resources in the background. Shutting off notifications (and iCloud on iPhones to avoid unnecessary uploading of data.

All of this could be configured to kick in as the amount of battery life remaining dwindles. At 30% shut off notifications and Bluetooth, at 25% iCloud and any open, but unused apps, and so on.

Another opportunity for saving comes from poorly coded applications which consume power when they are supposed to be doing nothing in the background – the iPhone Skype app had this issue for a while. An intelligent Endpoint Management app would monitor all apps energy use on the phone and report anomalous use to the user, along with an offer to close it (and potentially even offer to report the issue back to Apple and/or the app developer).

If this is reported transparently to the phone user, with an option of an opt-out, and with estimates of the amount that this will extend the battery life, most people will buy into it very quickly.

And it saves money, energy, and carbon emissions. Win, win and win.

Anyone coding Mobile Endpoint Management and not considering energy management is missing a trick.

Photo Credit Tom Raftery

post

Colt Technology and Verne Global’s dual renewably sourced data centre in Iceland

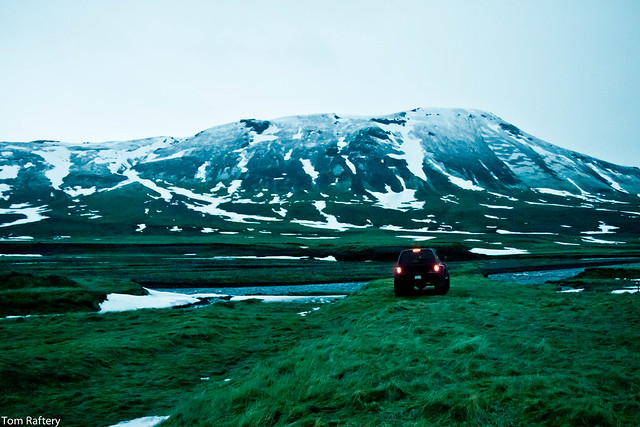
Icelandic landscape

Iceland’s a funny place. Despite the name, it never actually gets very cold there. The average low temperature in Winter is around -5C (22F) and the summer highs average around 13C (55.5F). Iceland is also unusual in that 100% of its electricity production comes from renewable energy (about 70% from hydro and 30% from geothermal).

I have written here several times about the high carbon cost of cloud computing, so when I received an invitation from Colt Technology to view the new data centre they had built with Verne Global in Iceland, I nearly bit their hand off!

The data centre is built on an 18-hectare (approximately 45-acre) complex west of Reykjavik, just beside Keflav?k Airport. The site is geologically stable and according to Verne:

The facility is situated on the site of the former Naval Air Station Keflavik, a key strategic NATO base for over 50 years and chosen for its extremely low risk of natural disaster. Located well to the west of all of Iceland’s volcanic activity, arctic breezes and the Gulf Stream push volcanic effects away from the Verne Global site and toward Western Europe.

Cold aisle contained racks in Verne Global's Iceland facility

Cold aisle contained racks in Verne Global's Iceland facility

The data centre was built using Colt Telecom’s modular data center design. This is essentially a data centre in a box! The modular data centre is built by Colt, shipped to site, (in this case, it was literally put on a ship and shipped to site – but the modules fit on a standard wide-load 18-wheeler), where it is commissioned. In the case of the Verne Global data centre, the build of the data centre took just 4 months because of the modular nature of the Colt solution, instead of the more typical 18 months. Also, modularity means it will be relatively straightforward to add extra capacity to the site, while keeping up-front data centre development costs down.

The data center has an impressive number of configurable efficiency features built-in. In the Verne Global facility, cold aisle containment is used and it is a wise choice in this environment. The facility uses only outside air for cooling (no chillers) so it makes sense to vent the hot air from the servers into a room being cooled by outside air. In winter, if the outside air is too cold, it can be mixed with hot air from the servers before entering the underfloor space to cool the servers.

The underfloor space is kept free of plenums and obstructions to allow an unimpeded flow of air from the variable speed fans – this minimises the work needed to be done by the fans, increasing their efficiency.

From an energy perspective, though, what makes the site very unique is that it sources its electricity from dual renewable sources (hydro and geothermal). Iceland is in quite a unique situation with its excess of abundant, cheap renewable power. Energy is so cheap in Iceland that aluminium smelting plants locate themselves there to take advantage of the power. These plants require roughly 400-500MW of constant power, so adding even 10 large data centres to the grid there would hardly be noticed on the system!

Another unique aspect of the Icelandic electricity is that because it is renewably sourced, its pricing is predictable (unlike fossil fuels). In fact, the Icelandic electricity provider, Landsvirkjun, offers contracts with guaranteed pricing up to 12 years. Also, the Icelandic grid ranks 2nd in the world for reliability and has the most competitive pricing in Europe (currently offering $43/MWh for 12 years as public offering – with better private offerings potentially available).

Speaking to Verne Global’s Lisa Rhodes, while in Iceland, she told me that because Verne had guaranteed energy pricing from Landsvirkjun for the next 20 years, they would be able to pass this on to Verne’s hosting customers and, in fact, she claimed that hosting in the Verne facility would cost 50-60% of the cost of hosting in the East coast of the US.

On the connectivity front, Colt announced that they were putting a Colt POP in the Verne facility, so it is connected directly into the Colt backbone.

Also, the Emerald Express fibre-optic cable which is due to be commissioned late this year has been designed to support 100x100Gbs on each of its six fibre pairs, which should easily meet any connectivity requirements Iceland should have well into the future.

Interestingly, one of Verne’s Global’s first customers is greenqloud – a company offering green public compute cloud services (an AWS EC2 and S3 drop-in replacement). With this, can we finally say that cloud computing can be green? Unfortunately, with cloud’s propensity to promote consumption of services, no, but at least with Greenqloud, your cloud can have a vastly reduced carbon footprint.

Full disclosure – I had my travel and accommodation paid for to visit this facility. And Colt has a POP in CIX, the data centre I co-founded in Cork before joining GreenMonk.

post

IBM launch Intelligent Water for Smarter Cities

Water

Intelligent water is the latest addition to the IBM Smarter Cities portfolio.

in the world’s cities are growing at an astounding rate. For the 1st time in history, over 50% of the world’s population now lives in urban areas. Over 1 million people are moving into cities every week, and it is estimated that by 2050 70% of people on the planet will live in cities.

This unprecedented growth in urban populations makes the provision of basic services like transport, security, water etc. increasingly complex. This is irrespective of whether the city is a mature city or a developing one. It was against this backdrop that IBM launched its Smarter Cities product.

At the core of this offering is its Intelligent Operation Center (IOC) which takes inputs from systems throughout the city and depending on the input, raises alerts, kicks off workflows, or displays the information on any of a number of dashboards which can be configured to display differing information based on a user’s login.

The newly announced Intelligent Water offering is yet another module capable of working with the IOC. In their briefing call, IBM were at pains to point out that their experience working with custom projects like the ones in Galway Bay, the Washington DC, and the Dubuque, Iowa all helped shape this new product.

Water issues are global in their reach, even if the difficulties differ from region to region (i.e. drought in Texas, flooding in Thailand, water quality in India).

IBM’s Intelligent Water helps organise water-related work. It drives proactive maintenance and schedules the maintenance so that the majority of the time is spent actually doing the maintenance, as opposed to driving between destinations. It allows water managers to see where the water is going – is it being delivered to customers, or disappearing through leaks in the pipework? Are customers using it effectively or not?

It integrates with geospatial packages and has map-based views, there are analytics for optimized scheduling, work order reporting, water usage reporting and display dashboards with roles-based information display. It is possible therefore to create views for the public (to display on the municipality’s website, for example), views for the Mayor’s office and others screens for the water planners and water operators.

According to IBM, Intelligent Water is available today. It comes with IBM’s business intelligence reporting tools as part of the solution and is available in standalone, cloud or hybrid versions.

I’m open to correction, but I’m not aware of any other company offering a comprehensive city management software solution like this. With cities growing at the rates they are, and most resources being finite, management solutions like this are going to be in greater and greater demand.

Photo credit Tom Raftery

post

Power Usage Efficiency (PUE) is a poor data center metric

Problems with PUE

Power Usage Effectiveness (PUE) is a widely used metric which is supposed to measure how efficient data centers are. It is the unit of data center efficiency regularly quoted by all the industry players (Facebook, Google, Microsoft, etc.).
However, despite it’s widespread usage, it is a very poor measure of data center energy efficiency or of a data center’s Green credentials.

Consider the example above (which I first saw espoused here) – in the first row, a typical data center has a total draw of 2MW of electricity for the entire facility. Of which 1MW goes to the IT equipment (servers, storage and networking equipment). This results in a PUE of 2.0.

If the data center owner then goes on an efficiency drive and reduces the IT equipment energy draw by 0.25MW (by turning off old servers, virtualising, etc.), then the total draw drops to 1.75MW (ignoring any reduced requirement for cooling from the lower IT draw). This causes the PUE to increase to 2.33.

When lower PUE’s are considered better (1.0 is the theoretical max), this is a ludicrous situation.

Then, consider that not alone is PUE a poor indicator of an data center’s energy efficiency, it is also a terrible indicator of how Green a data center is as Romonet’s Liam Newcombe points out.

Problems with PUE

Consider the example above – in the first row, a typical data center with a PUE of 1.5 uses an average energy supplier with a carbon intensity of 0.5kg CO2/kWh resulting in carbon emissions of 0.75kg CO2/kWh for the IT equipment.

Now look at the situation with a data center with a low PUE of 1.2 but sourcing energy from a supplier who burns a lot of coal, for example. Their carbon intensity of supply is 0.8kg CO2/kWh resulting in an IT equipment carbon intensity of 0.96kg CO2/kWh.

On the other hand look at the situation with a data center with a poor PUE of 3.0. If their energy supplier uses a lot of renewables (and/or nuclear) in their generation mix they could easily have a carbon intensity of 0.2kg CO2/kWh or lower. With 0.2 the IT equipment’s carbon emissions are 0.6kg CO2/kWh.

So, the data center with the lowest PUE by a long shot has the highest carbon footprint. While the data center with the ridiculously high PUE of 3.0 has by far the lowest carbon footprint. And that takes no consideration of the water footprint of the data center (nuclear power has an enormous water footprint) or its energy supplier.

The Green Grid is doing its best to address these deficiencies coming up with other useful metrics such as, Carbon Usage Effectiveness (CUE) and Water Usage Effectiveness (WUE).

Now, how to make these the standard measures for all data centers?

The images above are from the slides I used in the recent talk I gave on Cloud Computing’s Green Potential at a Green IT conference in Athens.