Search Results for: cloud

post

Technology for Good – episode fourteen with Twitter’s Andy Piper

Welcome to episode fourteen of the Technology for Good hangout. In this week’s episode we had the awesome Andy Piper from Twitter as a guest on the show. We had a lot of very interesting stories ta talk about this week, especially in the Apps and Wearables spaces, and as a result the hangout ran long, but it was all great stuff! Next week, I’ll try to keep the show shorter, but I have a great guest lined up, so I can’t make any promises 🙂

Here’s the stories that we discussed in this week’s show:

Climate

Cloud

Apps

Wearables

Data Centers

Misc

post

Technology for Good – episode thirteen with Diginomica’s Jon Reed

Welcome to episode thirteen of the Technology for Good hangout. In this week’s show we had the awesome Jon Reed from Diginomica as a guest on the show. Given that Earth Day fell this week, there were plenty of stories around environmental footprints as well as the more usual Internet of Things and Wearables topics.

Here’s the stories that we discussed in the show:

Climate

Footprint

Renewables

Connectivity

Security


Social

Wearables

Connected Car

Environment

Internet of Things (IoT)

Software

Misc.

post

Technology for Good – episode 12

Welcome to episode twelve of the Technology for Good hangout. In this week’s show we had two guests Chris Adams, and Kartik Kanakasabesan. Given the week that was in it with the Heartbleed bug, and the Samsung releases, there were plenty of stories around security and Wearables.

Here’s the stories that we discussed in the show:

Climate

Energy

Cloud

Wearables

Security

Internet of Things (IoT)

Misc

post

Technology for Good – episode eleven

Welcome to episode eleven of the Technology for Good hangout. In this week’s show our special guest was unable to make it due to looming deadlines, so I did the show solo. Given the week that was in it with Microsoft’s Build conference taking place, there were plenty of stories stemming from Microsoft’s various announcements, but there was also a ton of other news, as always.

Here’s the stories that I discussed in the show:

Climate

Cloud

Renewables

WiFi

Apps

Social

Internet of Things

Open

Misc

post

Technology for Good – episode ten

Welcome to episode ten of the Technology for Good hangout. In this week’s show we had special guest Bill Higgins, who works on IBM’s Cloud & Smarter Infrastructure. Given the week that was in it with Google’s slashing of cloud computing pricing, and Facebook’s purchase of Oculus Rift, there were plenty of stories about cloud computing and social networks.

Here’s the stories that we discussed in the show:

Climate

Renewables

Cloud

Social

Open

Internet of Things

Misc

post

Here comes the sun… IBM and solar forecasting

Concentrating solar power array

For decades now electricity grids have been architected in the same way with large centralised generation facilities pumping out electricity to large numbers of distributed consumers. Generation has been controlled, and predictable. This model is breaking down fast.

In the last decade we have seen a massive upsurge in the amount of renewable generation making its way onto the grid. Most of this new renewable generation is coming from wind and solar. Just last year (2013), almost a third of all newly added electricity generation in the US came from solar. That’s an unprecedented number which points to a rapid move away from the old order.

This raises big challenges for the grid operators and utilities. Now they are moving to a situation where generation is variable and not very predictable. And demand is also variable and only somewhat predictable. In a situation where supply and demand are both variable, grid stability can be an issue.

To counter this, a number of strategies are being looked at including demand response (managing the demand so it more closely mirrors the supply), storage (where excess generation is stored as heat, or potential energy, and released once generation drops and/or demand increases), and better forecasting of the generation from variable suppliers.

Some of the more successful work being done on forecasting generation from renewables is being undertaken by Dr Hendrik Hamann at IBM’s TJ Watson Research Center, in New York. Specifically Dr Hamann is looking at improving the accuracy of forecasting solar power generation. Solar is extremely complex to forecast because factors such as cloud cover, cloud opacity and wind have to be taken into account.
IBM Solar Forecaster
Dr Hamann uses a deep machine learning approach to tackle the many petabytes of big data generated by satellite images, ground observations, and solar databases. The results have been enviable apparently. According to Dr. Hamann, solar forecast accuracy using this approach is 50% more accurate than the next best forecasting model. And the same approach can be used to predict rainfall, surface temperature, and wind. In the case of wind, the forecast accuracy is 35% better than the next best model.

This is still very much a research project so there is no timeline yet on when (or even if) this will become a product, but if it does, I can see it being an extremely valuable tool for solar farm operators (to avoid fines for over-production, for example), for utilities to plan power purchases, and for grid management companies for grid stability purposes.

The fact that it is a cloud delivered (pun intended, sorry) solution would mean that if IBM brings it to market it will have a reduced cost and time to delivery, bringing it potentially within reach of smaller operators. And with the increase in the number of solar operators (140,000 individual solar installations in the U.S. in 2013) on the grid, highly accurate forecasting is becoming more important by the day.

post

Technology for Good – episode six

In episode 6 of the Technology for Good hangout we had lots to talk about, and I had Mr Chris Adams on with me to co-host. It was, of course, the week of IBM’s Pulse conference, as well as the Mobile World Congress, so there were lots of very exciting stories in the Mobile, Internet of Things, and security spaces, amongst others. The links to the stories are below.

As always, if you know of any stories you think we should cover, or someone we should be talking to, feel free to get in touch (@tomraftery on Twitter, or tom at redmonk.com on good old-fashioned email!).

And, here as promised, are the stories which made the cut for episode 6 of the Technology for Good hangout:

Intro

IBM Pulse

Security

Mobile

Heavy Industry

America

Misc

post

SAP TwoGo – ride-sharing software for the enterprise

In a less than obvious move earlier this week, SAP launched a ride-sharing app called TwoGo.

Why less than obvious? Well, ride-sharing is generally perceived as more of a consumer focused activity, than an enterprise one. And SAP is very much an Enterprise software company.

iPhone Rideshare apps

A quick search for ride-share iPhone apps, for example returns 24 results, all of which are consumer software plays.

TwoGo is more than just a smartphone app though (it is available on most mobile platforms), TwoGo customers can also access it through its website, via email, via any iCal enabled calendar application, and even via SMS.

It is a single instance, multi-tenant cloud application. This is important because it means for any organisations deploying TwoGo, set-up on SAP’s side simply involves adding the organisations email domain to the customer table. Then employees are immediately enabled to create a TwoGo account by signing up with their work email address.

Also, because it is single-instance and multi-tenant, smaller companies can sign up and benefit from sharing rides with employees of other companies in the area who are also TwoGo subscribers.

And because TwoGo works with email, and iCal already, integration issues are minimal.

Why would an organisation want to deploy a ride-sharing app, you ask?
There are several good reasons –

  • if companies are subsidising travel for employees, ride-sharing reduces the number of trips taken by employees, thereby contributing directly to the organisation’s bottom line.
  • For organisations with vehicle fleets, this also reduces wear and tear, service and maintenance costs for vehicles.
  • Then there’s the issue of having to provide car parking spaces for employees – this is expensive and a poor use of the space. Reducing the number of cars coming to work, de-facto reduces the amount of car parking spaces an organisation needs to provide.
  • And, obviously, ride-sharing will also reduce the organisation’s greenhouse gas emissions.

Then there’s the more intangible benefits –

  • Employees spending more time together leads to serendipitous meetings – what was previously ‘dead time’ in the car can now be productive
  • And it brings employees closer to each other and to the company

What about employees though – what benefits can they get from ride-sharing?
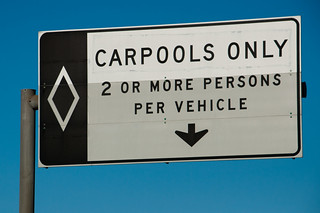
Carpool lane sign

  • The obvious one is the ability to use carpool lanes on freeways where traffic often moves significantly faster
  • Also, according to the US Census Bureau, nearly 600,000 Americans have “mega-commutes” of at least 90 minutes and 50 miles each way to work. A significant number of those would benefit from ride-sharing because of reduced costs (fuel and automobile wear and tear) and also to share the driving load. Driving, especially in heavy traffic, is frustrating.
  • Then there’s the social benefits of meeting new people, making new friends and learning more about other job functions in your organisation.

TwoGo, although just now being released, has been in operation at SAP for 2 years now. It is at release number 4.5, so this is already a mature product. SAP themselves report that TwoGo has generated more than $5 million in value, reduced greenhouse gas emissions by eliminating 400,000 miles of driving, and matched employees into carpools more than 36,000 times, creating 2,200 additional days of networking time among employees.

The app is highly configurable and has clever algorithms which only offer a user a ride to work, if it can also offer him/her a ride home that evening, as well. And obviously, the app has block lists to ensure you are not repeatedly offered lifts with someone you’d rather avoid.

Given all the benefits of TwoGo, we have to wonder why other enterprise software vendors haven’t come up with a similar product before now. Or have they? Does TwoGo have an enterprise competitor we’re not aware of?

Carpool lane image credit Lady Madonna

post

Facebook and ebay’s data centers are now vastly more transparent

ebay's digital service efficiency

Facebook announced at the end of last week new way to report PUE and WUE for its datacenters.

This comes hot on the heels of ebay’s announcement of its Digital Service Efficiency dashboard – a single-screen reporting the cost, performance and environmental impact of customer buy and sell transactions on ebay.

These dashboards are a big step forward in terms of making data centers more transparent about the resources they are consuming. And about the efficiency, or otherwise, of the data centers.

Even better, both organisations are going about making their dashboards a standard, thus making their data centers cross comparable with other organisations using the same dashboard.

Facebook Prineville Data Center dashboard

There are a number of important differences between the two dashboards, however.

To start with, Facebook’s data is in near-realtime (updated every minute, with a 2.5 hour delay in the data), whereas ebay’s data is updated every quarter of a year. So, ebay’s data is nowhere near realtime.

Facebook also includes environmental data (external temperature and humidity), as well as options to review the PUE, WUE, humidity and temperature data for the last 7 days, the last 30 days, the last 90 days and the last year.

On the other hand, ebay’s dashboard is, perhaps unsurprisingly, more business focussed giving metrics like revenue per user ($54), the number of transactions per kWh (45,914), the number of active users (112.3 million), etc. Facebook makes no mention anywhere of its revenue data, user data nor its transactions per kWh.

ebay pulls ahead on the environmental front because it reports its Carbon Usage Effeftiveness (CUE) in its dashboard, whereas Facebook completely ignores this vital metric. As we’ve said here before, CUE is a far better metric for measuring how green your data center is.

Facebook does get some points for reporting its carbon footprint elsewhere, but not for these data centers. This was obviously decided at some point in the design of its dashboards, and one has to wonder why.

The last big difference between the two is in how they are trying to get their dashboards more widely used. Facebook say they will submit the code for theirs to the Opencompute repository on Github. ebay, on the other hand, launched theirs at the Green Grid Forum 2013 in Santa Clara. They also published a PDF solution paper, which is a handy backgrounder, but nothing like the equivalent of dropping your code into Github.

The two companies could learn a lot from each other on how to improve their current dashboard implementations, but more importantly, so could the rest of the industry.

What are IBM, SAP, Amazon, and the other cloud providers doing to provide these kinds of dashboards for their users? GreenQloud has had this for their users for ages, now Facebook and ebay have zoomed past them too. When Facebook contributes oits codebase to Github, then the cloud companies will have one less excuse.

Image credit nicadlr

post

SAP releases its Integrated Report 2012 – an integrated financial and sustainability report

SAP released their first Sustainability report in 2008 (their 2007/2008 report). Like the reports of most other companies at the time, it was released as a PDF document but SAP quickly shifted gears. SAP’s 2008 Sustainability report, was released as a website. This had the dual purpose of making the site more accessible, and also allowing SAP to see which areas of the site had more traction. The following year they made their report more social and every year since they have added something new.

As well as releasing its Sustainability reports each year, SAP also published its annual financial reports. This year, for the first time, SAP have integrated the two reports and they have just published their SAP Integrated Report 2012. It takes the form of a highly interactive website with built-in analytics and downloadable PDF’s.

This was an idea GreenMonk first mooted when I asked SAP’s Chief Sustainability Officer Peter Graf in a 2011 interview whether SAP had any plans to integrate the two documents.

On a conference call at the launch of the integrated report, SAP Chief Accounting Officer Christoph Hütten went to great pains to stress that this wasn’t merely the content of both reports in one, but that the content was very tightly bound together. The report demonstrates how connections and inter-dependencies between financial and non-financial performance impact each other, he said.

The document/website contains all the financial and sustainability-related information you would expect to find in reports of this type. And the report also has a nice page showcasing and explaining the connections between the financial and non-financial performance.

Other nice features of the report are an integrated tweetstream showcasing mentions of the #sapintegrated hashtag on some pages, an option to make notes on pages (with the ability to download those pages as PDF’s subsequently), and the download centre for downloading the annotated pages, as well as financial statements, graphics and other reports.

For the first time also, SAP are releasing their 2012 sustainability information in XBRL format (.zip file) – something GreenMonk also suggested to SAP back in 2011. If you are unfamiliar with XBRL, it is an XML-based global standard for exchanging business information.

Impressive as well was the fact that at the end of the conference call launching the report, Peter Graf mentioned that SAP are actively looking to co-innovate. He asked that anyone, be they in the financial or sustainability reporting space, who is interested in integrated reporting get in touch with him to work together to bring integrated reporting to everyone “at the lowest possible cost and highest possible precision”.

The video above is a demo of the report and I have placed a transcript of the video here.