After we wrote a post about the Lifx, Internet of Things connected LED lights a few weeks back, we reached out to Philips to see if we could get a Philips Hue kit to try out for comparison. Philips obliged and sent us a kit which contains 3 LED lights, and a Hue bridge.
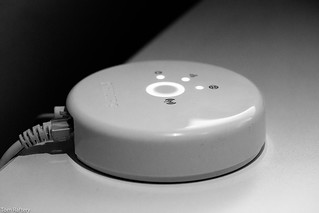
Philips Hue bridge
As a bit of background, the way the Philips Hue system works is that you receive a device called a bridge with your bulbs which you need connect into your internet router. This device talks to the Philips Hue bulbs over the ZigBee protocol, and also is capable of connecting to the Internet via your router. Thus your Philips Hue bulbs are capable of being controlled not just from inside your home, but also from outside the home using the free Philips Hue smartphone app (available for both Android and iOS).
The smartphone app has a lot of extra functionality built-in. The app enables users:
- to change the colour of the light coming from the bulbs (across the full spectrum of visible light), as well as the intensity
- to use pre-built recipes which come with the app for different light intensities and colours. These recipes are editable, and owners can create their own recipes and share them with the Hue community
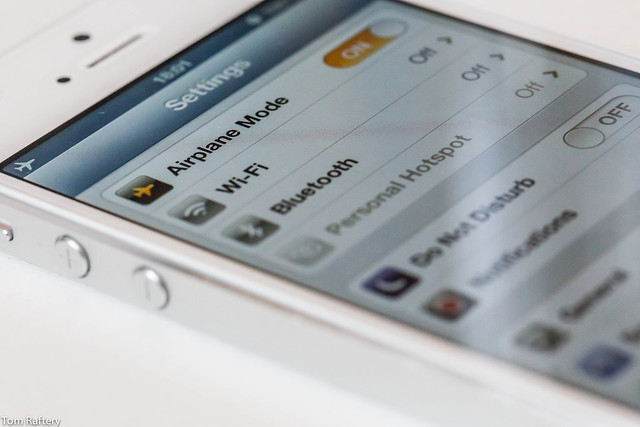
- set-up Geofencing, so it’s possible to have the lights automatically go off when you leave home, and come on when you approach home
- create alarms such that the lights simulate a sunrise early in the morning, or a sunset late at night. The sunrise functionality can be especially useful if you find it hard to awake on dark winter mornings
- to control lights remotely – this is useful if you don’t use the geofencing functionality and you want to check if you turned the lights off after you go out, or if you don’t want to enter a dark home
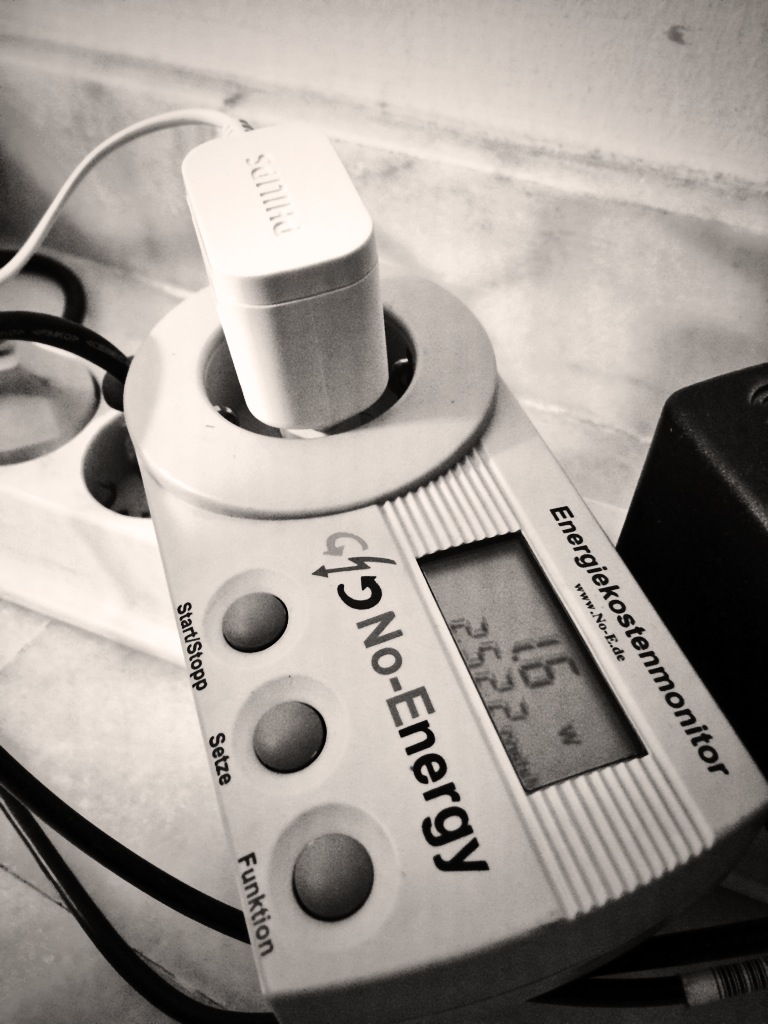
Philips Hue Bridge Power consumption
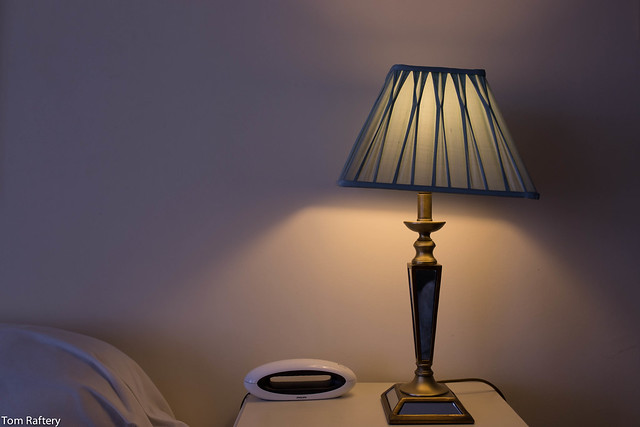
The bulbs, as can be seen in the video give out good light (600 Lumen at full intensity) over a large range of colours, and using very little electricity. Typical consumption, at full intensity, and a colour temperature of around 3000K, is 5W. However, the bulbs also draw a constant 0.4W when they are turned off by the app (as opposed to being turned off at the physical switch). This is so they can maintain their Zigbee connection to the bridge, in order to be able to come respond to the smartphone app (alarms, remote on/off requests, geofencing, etc.). And the bridge itself consumes a constant 1.6W, so the three bulbs, plus the bridge, have a baseline consumption of 2.8W.
When you compare the 2.8W to 60W from a conventional incandescent bulb, it doesn’t appear to be a huge draw, but over 24 hours it does add up (it is the equivalent of leaving a 60W bulb on for a little over an hour and seven minutes per day).
To avoid burning the constant 2.8W you can of course turn the bulbs off at the wall (or the switch). Then they are no longer in ‘listening mode’ and consume 0W, instead of the constant 0.4W. In this scenario, the electricity draw is reduced to just the 1.6W from the bridge. Over 24 hours this is equivalent to leaving a 60W bulb on for just over 38 minutes. The advantage of this approach is lower electricity consumption, the disadvantage is that the Hue bulbs are no longer connected to the Internet of Things.
This constant nibbling of power by the Hue devices is by no means unique to Philips. By definition any devices constantly connected to the Internet are also constantly consuming power – which raises interesting questions around the costs and benefits of Internet of Things connected devices.