post

Technology for Good – episode ten

Welcome to episode ten of the Technology for Good hangout. In this week’s show we had special guest Bill Higgins, who works on IBM’s Cloud & Smarter Infrastructure. Given the week that was in it with Google’s slashing of cloud computing pricing, and Facebook’s purchase of Oculus Rift, there were plenty of stories about cloud computing and social networks.

Here’s the stories that we discussed in the show:

Climate

Renewables

Cloud

Social

Open

Internet of Things

Misc

post

People as Sensors – mining social media for meaningful information

I gave a talk at our recent ThingMonk, Internet of Things conference in London which I titled People as Sensors – mining Social Media for Good. The talk was principally about the many use cases where the firehose that is social media can now be analysed in realtime, and real, meaningful information can be extracted from it.

Feedback on the talk was extremely positive, so I said I’d post the video here.

Here’s the transcript of my talk:

Thanks very much! People As Sensors, it’s the idea of mining social media for useful information.

Obviously we have heard about the difference between data and information this morning, so we are just going to power through a little bit about that.

This slide deck is already up on SlideShare, so anyone wants to have a look at it, it’s there. I have my notes published, my notes for the slides published with the slides on SlideShare, so if you want to download it, you will get the notes there as well.

So mobile data; every one of us has got one of these little devices, and it’s publishing, not just the information that we publish ourselves, but also a lot of other information as well.

And this was brought home to us in 2009 very clearly when a german politician called Malte Spitz sued Deutsche Telecom because of the data retention laws in Germany that had just been legislated and he asked them for his data, he wanted the six months of data that they had on retention for him.

Can I get a show of hands here for anyone who has not heard the story already? Okay, a good few people haven’t.

So I will just break out of the presentation for a second, because — if I can; apparently it doesn’t want to. Okay, I will just — no, it doesn’t want to. What he did was he published the information in ZEIT ONLINE, and the link is at the bottom there, and all these screens that I have, all these slides that I have, they have a link at the bottom, it’s a clickable link; it’s a clickable link in the PDF on the SlideShare as well, so you can go and you can view this data.

There is a Play bottom in the bottom left there. You can hit Play on that button on the site and you can go through the six months of his life and it plays where he goes.

So when he gets on the train, the little dot there moves along the map, so you can see where he was for almost all the time of that six months. It lights up a little mobile phone icon when he is on the phone, when he is making a phone call or sending texts.

You can see where he sleeps, you can see when he sleeps, you can see when he gets up, it’s all there, and it’s all beautifully visualized. And when you see something as stark as that you suddenly realize, Jesus, we are really publishing a lot of information, aren’t we?

And it’s not just that kind of information; we are publishing a load of stuff in social medial as well. So you just take a quick look at some of the numbers in social media and you realize how big it is. Facebook have announced now that they have got 1.2 billion users and the latest numbers that they published in August, they talk about 4.5 billion likes per month, 4.75 billion items published — oh no, that’s per day. 4.5 billion likes per day, 4.75 billion items published per day, and I have forgotten how many billion photographs. It’s just insane.

Twitter, this is a typical diurnal graph of Twitter tweets per second. So you are starting at kind of midnight on the left, you are going across through the morning. It peaks at around — okay, over there it peaks at around 8,000, a little over 8,000, dips again mid-afternoon, picks up, and then drops off at nighttime. That’s daily.

The average number of tweets they say it’s around 6,000 tweets per second, and this is tweets per day over a 365 day period. You can see 400,000 going up to around 600,000 tweets per day now.

And Twitter are actually selling this data. They announced in their filing for the IPO that they have made about 47.5 million, which is quite modest I would have thought, selling direct access to their data. So people who buy their data from them house their servers in the same complex as the Twitter servers and get direct access to all the tweets that have been published instantaneously so they can mine it there and then.

So it’s not just Twitter, it’s not just Facebook, you have got Google+ talking about 500 million users, 300 million in the stream.

Sina Weibo; we are talking about 500 million users and growing. And you have got other networks as well; Waze, which was recently bought by Google, is a GPS application, which is great, but it’s a community one as well. So you go in and you join it and you publish where you are, you plot routes.

If there are accidents on route, or if there is police checkpoints on route, or speed cameras, or hazards, you can click to publish those as well. It’s a very simple interface, so that it doesn’t interfere with your driving, or it’s minimal interference with your driving. And I will come back to why that’s interesting in a few minutes.

And I am rushing through this because I have got 50 something slides and James wants me to do it in 15 minutes. So here are some of the use cases from all that data, and there are some nice ones out there. A lot of you are probably familiar with this one; it’s the UK snow meteorology example. It was one that was put up a couple of years back and it has been used every year every time there is snow in the UK.

There is a little dash of snow over London there in this screenshot, because there wasn’t one when I went to the site, so I tweeted about it, and got a bit of snow to fall on EC 2 there.

Utility companies are starting to use social media increasingly for outage management. So GE have got this Grid Insight Application, and what they do is if a utility company has an outage in their area, they can look for mentions of the outage on social media channels. And in this picture here you see someone has tweeted a photograph of a tree, which is after taking down an electricity line, so not they have a good idea of what the issue is.

This is in real time. So instead of having to send out an investigatory truck roll, they just send out the vegetation truck roll, and that cuts down massively on the time to get the outage fixed and get people back live again.

And this is another one, you can see here there is a fire in the substation, and it’s right beside a road, and you can see a cluster of Twitter — maybe not, you would have to look closely, but those are the blue dots there, those are little clusters of tweets and Facebook posts, and you have got a Facebook video posted of the fire in the substation.

Other things; the United Nations Development Project are analyzing in real time social media. This is the project they ran to analyze social media, because they want to know when there are likely risks to their people on the ground.

This is one they did in Georgia around the time of the upset between Georgia and South Ossetia in 2008-2009. So they looked at the mentions there and they graphed it versus when the trouble actually happened. So now they are building a model so they can call their people and say, okay, look, it has gotten to the point where it’s getting risky for you guys to be in there, we need to get you out now.

Automotive; the automotive industry are starting to use this. There was an application developed by the Pamplin College in University of Virginia Tech where they started mining social media for mentions of particular, what they call, smoke terms. These were terms which are important for the automobile industry and so they can identify quickly when faults come in cars.

This is a much faster way of reporting faults back to the manufacturer rather than going back up to the dealer network, which can take weeks and months. If they are getting it directly from the consumers, they get it faster, they do the recall faster, and you have got safety issues there, you are saving people’s lives. Plus, you are also having to recall fewer cars because few of them have been sold by the time the issue comes to life.

In the finance industry; this is a paper that was published. It was published in, I think it was 2009, and it said that Twitter can predict the stock market with 87% accuracy, and again, the link is at the bottom, you can click through and read the paper.

So on the back of that this UK crowd called Derwent Capital Management licensed the technology and set up a fund, and it has now become Cayman Atlantic, and they are doing quite well apparently. And there are several other companies who are doing similar now as well, using Twitter to predict the stock market.

In law enforcement social media is huge, it’s absolutely huge. A lot of the police forces now are actively mining Facebook and Twitter for different things. Like some of them are doing it for gang structures, using people’s social graph to determine gang structures. They also do it for alibis. All my tweets are geo-stamped, or almost all, I turned it off this morning because I was running out of battery, but almost all my tweets are geo-stamped. So that’s a nice alibi for me if I am not doing anything wrong.

But similarly, it’s a way for authorities to know where you were if there is an issue that you might be involved in, or not. So that’s one.

They also use it for interacting with people. They set up fake profiles and interact with suspects as well and try and get them to admit and all that kind of stuff.

I have a few extra slides hidden here, because James asked me to crunch this down. If you do download it, you will get all the sides there, and they are some very interesting ones. If you have an interest in the law enforcement angle, there are some great case studies that you can look into there.

Obviously the law enforcement one is one you have got to be very careful of, because you have issues there around the whole Minority Report and Precrime, and it’s more of a dodgy one than many of the other ones I have been talking about.

Smart cities; we heard people talking about smart cities this morning. This is the City of Boston and they have got their citizens connect to application, and that allows people with a smartphone, and it’s agnostic; it can be Android, iOS, I am not sure if they do BlackBerry, but Android and iOS are covered anyway. You can report potholes, street lights, graffiti, sidewalk patches, whatever those are, and damage signs and others.

You get reports back when you report something to the City of Boston, and a couple of other cities are rolling these out as well, but in this particular one, when you report an issue to the City of Boston, you get a communication back from the city telling you who is assigned to fix that particular item you have reported. And then that person contacts you to say when they have done it, and often they will photograph it and you get a photograph of the item you have reported having been fixed by the named person who has done it. So very smart.

Healthcare; healthcare is a big one as well. You are probably familiar with Google Trends and Google Flu Trends, so Google Flu Trends, they take the search data to predict when there are likely flu outbreaks.

Well, they went a step further and they funded this paper, which was published in the American Journal of Tropical Medicine and Hygiene, and what they did was they looked at the data, the social media data for mentions of cholera and cholera symptoms in Haiti in 2010 after the earthquake there. And they found that the mentions of cholera and cholera symptoms on social media tracked exactly with the governmental data, so it was an exact match. The only difference being it was two weeks ahead of the government data.

So you can imagine two weeks on a cholera outbreak, the number of lives you could save, so really important stuff.

There is also this fantastic application which was called Asthmapolis and is now called Propeller Health. And what that is, it’s a little device that sits on top of an inhaler, so when you give a puff on your inhaler, it reports it with GPS and timestamp.

So when you go to your doctor, your doctor then can see a map of where and when you puffed on your inhaler, and you get to see it as well. So you start to see patterns in when you used your inhaler.

So you might say every time I visit my friend’s house, I use the inhaler more. They are a smoker. Okay, so now I need to be aware.

Or every time I am on my way to work, when I pass this particular place I use the inhaler, maybe I should take a different route.

But it goes a step beyond that as well. They have gotten the City of Louisville, in Kentucky to roll this out to all their asthma people. And they have a particular issue with pollution in Louisville, because there is a 13 year lifespan difference in people’s expected lifespan depending on where they live in Louisville.

So you live in one place, you live 13 years less than your neighbors. So they are using this application to try and help them identify and to try and help them clean up the City of Louisville, so a really interesting application there.

In CRM, Customer Relationship Management, it was T-Mobile in the U.S. who went through the millions of customer records they had, they went through their billing records, they went through mentions in social media. They had, I think it was 33 million customers, and they were losing customers all over the place.

When they started analyzing the social media mentions, matched it up with the billing records, etcetera, and they started taking preventative action for people they identified as likely to defect, they halved their defections in three months.

So they cut down on their customer defections, in three months they cut them down by 50%. Amazing!

Brand management; a couple of years ago Nestlé got Greenpeace. They were sourcing palm oil for making their confectionary from unsustainable sources, from — Sinar Mas was the name of the company and they were deforesting Indonesia to make the palm oil.

So Greenpeace put up a very effective viral video campaign to highlight this, and this actually had an impact on Nestlé’s stock price, short-term, small impact, but it had an impact on their stock price, as well as the reputational issues.

Nestlé put in place a Digital Acceleration Team who monitor very closely now mentions of Nestlé online and as a result of that this year, for the first time ever, Nestlé are in the top ten companies in the world in the Reputation Institute’s Repute Track Metric. So they are now considered globally as one of the more reputable industries, at least partly as a result of this.

In transportation; I mentioned Waze earlier. So Google Maps have now started to incorporate data from Waze. So right here you can see a screenshot of someone’s Google Maps and it’s highlighting that there was an accident reported on this particular road via Waze, via the Waze App. So that’s really impressive, you are on your Google Maps and now you are notified ahead of time that there has been an accident up the road, you have a chance to reroute.

Also in transportation, this is a lovely little example; Orange in the Ivory Coast, they took, I think it was — I have it noted here somewhere, 5 million Orange users, 2.5 billion anonymized records from their data.

Anonymized released it and said, okay, let’s see what you can do with this anonymized data from our customers. There is a competition. The best use was where they remapped the country’s public transport because they could see looking at people’s mobile phone records where people were going during the day.

So they said, okay, people are going from here to here, but our bus route goes from here to here, to here, to here, let’s redraw the bus route this way where people actually want to go. Simple! Beautiful application of data, the data that we all published all the time, to make people’s lives easier. They reckon they saved the first 10% of people’s commute times.

Looking ahead, and I am wrapping up here James, wherever he is, you have got things like Google Glass, which will now be publishing people’s data as well.

You have got this thing called Instabeat, and what it is, it’s like Google Glass for swimmers. So it has got a little display inside people’s goggles as they are swimming, so they can see how fast their heart rate is; they can see several of the kind of things that you want when you are a competitive swimmer and you are trying to up your game.

And you have got all the usual stuff that we are all aware of, the Jawbones and all these other things that people are using to track their fitness.

More and more we are being quantified, we are generating more and more data, and it’s going to be really interesting to see the applications that come from this data.

So the conclusion from all of this very quickly, data and the data sources are increasing exponentially, let’s go hack that data for good.

Thank you!

post

Facebook and ebay’s data centers are now vastly more transparent

ebay's digital service efficiency

Facebook announced at the end of last week new way to report PUE and WUE for its datacenters.

This comes hot on the heels of ebay’s announcement of its Digital Service Efficiency dashboard – a single-screen reporting the cost, performance and environmental impact of customer buy and sell transactions on ebay.

These dashboards are a big step forward in terms of making data centers more transparent about the resources they are consuming. And about the efficiency, or otherwise, of the data centers.

Even better, both organisations are going about making their dashboards a standard, thus making their data centers cross comparable with other organisations using the same dashboard.

Facebook Prineville Data Center dashboard

There are a number of important differences between the two dashboards, however.

To start with, Facebook’s data is in near-realtime (updated every minute, with a 2.5 hour delay in the data), whereas ebay’s data is updated every quarter of a year. So, ebay’s data is nowhere near realtime.

Facebook also includes environmental data (external temperature and humidity), as well as options to review the PUE, WUE, humidity and temperature data for the last 7 days, the last 30 days, the last 90 days and the last year.

On the other hand, ebay’s dashboard is, perhaps unsurprisingly, more business focussed giving metrics like revenue per user ($54), the number of transactions per kWh (45,914), the number of active users (112.3 million), etc. Facebook makes no mention anywhere of its revenue data, user data nor its transactions per kWh.

ebay pulls ahead on the environmental front because it reports its Carbon Usage Effeftiveness (CUE) in its dashboard, whereas Facebook completely ignores this vital metric. As we’ve said here before, CUE is a far better metric for measuring how green your data center is.

Facebook does get some points for reporting its carbon footprint elsewhere, but not for these data centers. This was obviously decided at some point in the design of its dashboards, and one has to wonder why.

The last big difference between the two is in how they are trying to get their dashboards more widely used. Facebook say they will submit the code for theirs to the Opencompute repository on Github. ebay, on the other hand, launched theirs at the Green Grid Forum 2013 in Santa Clara. They also published a PDF solution paper, which is a handy backgrounder, but nothing like the equivalent of dropping your code into Github.

The two companies could learn a lot from each other on how to improve their current dashboard implementations, but more importantly, so could the rest of the industry.

What are IBM, SAP, Amazon, and the other cloud providers doing to provide these kinds of dashboards for their users? GreenQloud has had this for their users for ages, now Facebook and ebay have zoomed past them too. When Facebook contributes oits codebase to Github, then the cloud companies will have one less excuse.

Image credit nicadlr

post

Social media and utility companies

I’m moderating a panel discussion on social media and utilities at next week’s SAP for Utilities event in Copenhagen. My fellow panelists will include two representatives from utility companies, and one from SAP.

This is not new ground for me, I have given the closing keynotes at the SAP for Utilities in San Antonio in 2011 and the SAP for Utilities event in Singapore in 2012, both times on this topic.

In my previous talks on this topic I start out talking about how utilities have started to use social media for next generation customer service – this is an obvious use case and there are several great examples of utilities doing just this.

However, there are also other very compelling use cases for social in utilities. In the US over one third of the workforce is already over 50 years old, and according to the US Bureau of Labor Statistics 30-40% of the workforce will retire in the next 10 years. This is not confined to the US and so recruitment and retention are topics of growing concern for utilities.

Now, utilities are rarely seen by young graduates as a ‘cool’ place to work. But this can change. Remember a couple of years back when Old Spice was the cologne your grandad might wear? Old Spice rolled out a social media campaign with a superb series of YouTube ads (the first of which has been viewed 45 million times). In the month which followed their sales went up 100%, and a year later their sales were still up 50%.

Videos like the one above produced by Ausgrid, while not about to rival Old Spice for viewership, do show a more human and appealing side of the company to any potential employees.

Rotary dial phone

Also, when I ask utility companies whether they allow employees to access social media from their work computers, the majority of times the answer is no, or limited. Even if only from the perspective of retaining good employees, this has to change. Today’s millennials are far more likely to use social media as a way to network and find information online (see chapter four of this three year old Pew Research study on Millennials [PDF] for more on this). Blocking access to social media sites, especially for younger employees, is analogous to putting a rotary dial phone on their desk, with a padlock on the dial. Don’t just take my word for it. Casey Coleman, the CIO of the U.S. General Services Administration said recently:

Twitter is a primary source to gather information about changes in my industry. It helps the organization stay current with the latest trends and thinking.

Blocking employees access to social media stifles them from doing their job effectively, and any employee who feels that s/he is not being allowed to do their job properly won’t be long about looking for a new one.

Social media can also be used internally as a means of retaining knowledge from retiring workers, and as a way of making employees more productive using internal social collaboration tools (Jam, Huddle, Chatter, etc.).

Finally, as I’ve mentioned before, with the rise of mobile usage of social media, there is now the ability to tap into social media’s big data firehose in realtime to improve on outage management.

There are bound to be more uses of social media (real or potential) that I’m missing – if you can think of any, please leave a comment on this post letting us all here know.

Also, the panel discussion is on next Friday April 19th at 3pm CET – we’ll be watching the Twitter hashtag #SocialUtils. If you have any questions/suggestions to put to the panel, leave them there and we’ll do our best to get to them.

post

Sustainability, social media and big data

The term Big Data is becoming the buzz word du jour in IT these days popping up everywhere, but with good reason – more and more data is being collected, curated and analysed today, than ever before.

Dick Costolo, CEO of Twitter announced last week that Twitter is now publishing 500 million tweets per day. Not alone is Twitter publishing them though, it is organising them and storing them in perpetuity. That’s a lot of storage, and 500 million tweets per day (and rising) is big data, no doubt.

And Facebook similarly announced that 2.5 billion content items are shared per day on its platform, and it records 2.7 billion Likes per day. Now that’s big data.

But for really big data, it is hard to beat the fact that CERN’s Large Hadron Collider creates 1 petabyte of information every second!

And this has what to do with Sustainability, I hear you ask.

Well, it is all about the information you can extract from that data – and there are some fascinating use cases starting to emerge.

A study published in the American Journal of Tropical Medicine and Hygiene found that Twitter was as accurate as official sources in tracking the cholera epidemic in Haiti in the wake of the deadly earthquake there. The big difference between Twitter as a predictor of this epidemic and the official sources is that Twitter was 2 weeks faster at predicting it. There’s a lot of good that can be done in crisis situations with a two week head start.

Another fascinating use case I came across is using social media as an early predictor of faults in automobiles. A social media monitoring tool developed by Virginia Tech’s Pamplin College of Business can provide car makers with an efficient way to discover and classify vehicle defects. Again, although at early stages of development yet, it shows promising results, and anything which can improve the safety of automobiles can have a very large impact (no pun!).

GE's Grid IQ Insight social media monitoring tool

GE have come up with another fascinating way to mine big data for good. Their Grid IQ Insight tool, slated for release next year, can mine social media for mentions of electrical outages. When those posts are geotagged (as many social media posts now are), utilities using Grid IQ Insight can get an early notification of an outage in its area. Clusters of mentions can help with confirmation and localisation. Photos or videos added of trees down, or (as in this photo) of a fire in a substation can help the utility decide which personnel and equipment to add to the truckroll to repair the fault. Speeding up the repair process and getting customers back on a working electricity grid once again can be critical in an age where so many of our devices rely on electricity to operate.

Finally, many companies are now using products like Radian6 (now re-branded as Salesforce Marketing Cloud) to actively monitor social media for mentions of their brand, so they can respond in a timely manner. Gatorade in the video above is one good example. So too are Dell. Dell have a Social Media Listening Command Centre which is staffed by 70 employees who listen for and respond to mentions of Dell products 24 hours a day in 11 languages (English, plus Japanese, Chinese, Portugese, Spanish, French, German, Norwegian, Danish, Swedish, and Korean). The sustainability angle of this story is that Dell took their learnings from setting up this command centre and used them to help the American Red Cross set up a similar command centre. Dell also contributed funding and equipment to help get his off the ground.

No doubt the Command Centre is proving itself invaluable to the American Red Cross this week mining big data to help people in need in the aftermath of Hurricane Sandy.

post

Smartphone energy management – when will there be an app for that?

Mobile energy saving app?

I wrote a post last week about mobile endpoint management applications and their potential to extend smartphone battery life. It seems it was a prescient piece given the emergence this week of a study from Purdue University and Microsoft Research showing how energy is used by some smartphone applications [PDF].

The study indicates that many free, ad-supported applications expend most of their energy on serving the ads, as opposed to on the application itself. As an example, the core part of the free version of Angry Birds on Android uses only 18% of the total app energy. Most of the rest of the energy is used in gathering location, and handset details for upload to the ad server, downloading the ad, and the 3G tail.

This behaviour was similar in other free apps, such as Free Chess, NYTimes which were tested on Android and an energy bug found in Facebook causing the app to drain power even after termination, was confirmed fixed in the next version released (v1.3.1).

The researchers also performed this testing on Windows Mobile 6.5 but in the published paper, only the Android results are discussed.

Inmobi’s Terence Egan pushed back against some of the findings noting that

In one case, the researchers only looked at the first 33 seconds of usage when playing a chess game.

Naturally, at start up, an app will open communications to download an ad. Once the ad has been received, the app shouldn?t poll for another ad for some time.

Hver the time it take to play a game of chess (the computer usually beats me in 10 minutes) a few ad calls are dwarfed by the energy consumption of the screen, the speakers, and the haptic feedback.

Although, in a tacit admission that this is a potential issue further down in his post he lists handy best practices for developers to make “ad calls as battery friendly as possible”

The iPhone iOS operating system wasn’t looked at in this study at all but it is not immune from these issues either. And, in fact, reports are emerging now that the new iPad is unable to charge when certain energy intensive apps are running.

While it is important to remind developers of the need for green coding, not all coders will heed the advice and there will always be rogue apps out there draining your smartphone’s battery.

And this is not just a consumer issue – for enterprises it is important to keep the organisation’s smartphone owners happy, connected, and above all, productive. A drained battery is ultimately a disconnected, unproductive and frustrated employee. Reducing a phone’s energy use is, obviously a sustainability win too.

Mobile endpoint management applications could use technology similar to the eprof software used in the study, to identify bugs or rogue applications on phones. This could be reported back to a central database to alert users (and app developers) of issues found.

With more and more apps coming on the market, this is an issue which is only going to become more pronounced. Someone is going to come out with a decent mobile energy management app sooner, rather than later. It will be interesting to see where it comes from.

Photo Credit Tom Raftery

post

Facebook hires Google’s former Green Energy Czar Bill Weihl, and increases its commitment to renewables

Christina Page, Yahoo & Bill Weihl, Google - Green:Net 2011

Google has had an impressive record in renewable energy. They invested over $850m dollars in renewable energy projects to do with geothermal, solar and wind energy. They entered into 20 year power purchase agreements with wind farm producers guaranteeing to buy their energy at an agreed price for twenty years giving the wind farms an income stream with which to approach investors about further investment and giving Google certainty about the price of their energy for the next twenty years – a definite win-win.

Google also set up RE < C – an ambitious research project looking at ways to make renewable energy cheaper than coal (unfortunately this project was shelved recently).

And Google set up a company called Google Energy to trade energy on the wholesale market. Google Energy buys renewable energy from renewable producers and when it has an excess over Google’s requirements, it sells this energy and gets Renewable Energy Certificates for it.

All hugely innovative stuff and all instituted under the stewardship of Google’s Green Energy Czar, Bill Weihl (on the right in the photo above).

However Bill, who left Google in November, is now set to start working for Facebook this coming January.

Facebook’s commitment to renewable energy has not been particularly inspiring to-date. They drew criticism for the placement of their Prineville data center because, although it is highly energy efficient, it sources its electricity from PacificCorp, a utility which mines 9.6 million tons of coal every year! Greenpeace mounted a highly visible campaign calling on Facebook to unfriend coal using Facebook’s own platform.

The campaign appears to have been quite successful – Facebook’s latest data center announcement has been about the opening of their latest facility in Lulea, Sweden. The data center, when it opens in 2012, will source most of its energy from renewable sources and the northerly latitudes in Lulea means it will have significant free cooling at its disposal.

Then in December of this year (2011) Facebook and Greenpeace issued a joint statement [PDF] where they say:

Facebook is committed to supporting the development of clean and renewable sources of energy, and our goal is to power all of our operations with clean and renewable energy.

In the statement Facebook commits to adopting a data center siting policy which states a preference for clean and renewable energy and crucially, they also commit to

Engaging in a dialogue with our utility providers about increasing the supply of clean energy that power Facebook data centers

So, not alone will Facebook decide where their future data centers will be located, based on the availability of renewable energy, but Facebook will encourage its existing utility providers to increase the amount of renewables in their mix. This is a seriously big deal as it increases the demand for renewable energy from utilities. As more and more people and companies demand renewable energy, utilities will need to source more renewable generation to meet this demand.

And all of this is before Google’s former Green Energy Czar officially joins Facebook this coming January.

If Bill Weihl can bring the amount of innovation and enthusiasm to Facebook that he engendered in Google, we could see some fascinating energy announcements coming from Facebook in the coming year.

Photo credit Jaymi Heimbuch

post

Power Usage Efficiency (PUE) is a poor data center metric

Problems with PUE

Power Usage Effectiveness (PUE) is a widely used metric which is supposed to measure how efficient data centers are. It is the unit of data center efficiency regularly quoted by all the industry players (Facebook, Google, Microsoft, etc.).
However, despite it’s widespread usage, it is a very poor measure of data center energy efficiency or of a data center’s Green credentials.

Consider the example above (which I first saw espoused here) – in the first row, a typical data center has a total draw of 2MW of electricity for the entire facility. Of which 1MW goes to the IT equipment (servers, storage and networking equipment). This results in a PUE of 2.0.

If the data center owner then goes on an efficiency drive and reduces the IT equipment energy draw by 0.25MW (by turning off old servers, virtualising, etc.), then the total draw drops to 1.75MW (ignoring any reduced requirement for cooling from the lower IT draw). This causes the PUE to increase to 2.33.

When lower PUE’s are considered better (1.0 is the theoretical max), this is a ludicrous situation.

Then, consider that not alone is PUE a poor indicator of an data center’s energy efficiency, it is also a terrible indicator of how Green a data center is as Romonet’s Liam Newcombe points out.

Problems with PUE

Consider the example above – in the first row, a typical data center with a PUE of 1.5 uses an average energy supplier with a carbon intensity of 0.5kg CO2/kWh resulting in carbon emissions of 0.75kg CO2/kWh for the IT equipment.

Now look at the situation with a data center with a low PUE of 1.2 but sourcing energy from a supplier who burns a lot of coal, for example. Their carbon intensity of supply is 0.8kg CO2/kWh resulting in an IT equipment carbon intensity of 0.96kg CO2/kWh.

On the other hand look at the situation with a data center with a poor PUE of 3.0. If their energy supplier uses a lot of renewables (and/or nuclear) in their generation mix they could easily have a carbon intensity of 0.2kg CO2/kWh or lower. With 0.2 the IT equipment’s carbon emissions are 0.6kg CO2/kWh.

So, the data center with the lowest PUE by a long shot has the highest carbon footprint. While the data center with the ridiculously high PUE of 3.0 has by far the lowest carbon footprint. And that takes no consideration of the water footprint of the data center (nuclear power has an enormous water footprint) or its energy supplier.

The Green Grid is doing its best to address these deficiencies coming up with other useful metrics such as, Carbon Usage Effectiveness (CUE) and Water Usage Effectiveness (WUE).

Now, how to make these the standard measures for all data centers?

The images above are from the slides I used in the recent talk I gave on Cloud Computing’s Green Potential at a Green IT conference in Athens.

post

HP joins ranks of microserver providers with Redstone

Redstone server platform

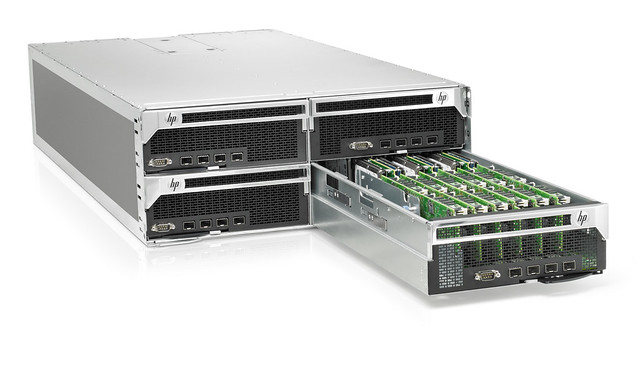
The machine in the photo above is HP’s newly announced Redstone server development platform.

Capable of fitting 288 servers into a 4U rack enclosure, it packs a lot of punch into a small space. The servers are System on a Chip based on Calxeda ARM processors but according to HP, future versions will include “Intel? Atom?-based processors as well as others”

These are not the kind of servers you deploy to host your blog and a couple of photos. No, these are the kinds of servers deployed by the literal shedload by hosting companies, or cloud companies to get the maximum performance for the minimum energy hit. This has very little to do with these companies developing a sudden green conscience, rather it is the rising energy costs of running server infrastructure that is the primary motivator here.

This announcement is part of a larger move by HP (called Project Moonshot), designed to advance HP’s position in the burgeoning low-energy server marketplace.

Nor is this anything very new or unique to HP. Dell have been producing microservers for over three years now. In June and July of this year (2011) they launched the 3rd generations of their AMD and Intel based PowerEdge microservers respectively.

And it’s not just Dell, Seamicro has been producing Atom-based microservers for several years now. Their latest server, the SM10000-64 contains 384 processors per system in a 10U chassis with a very low energy footprint.

And back in April of this year Facebook announced its Open Compute initiative to open-source the development of vanity free, low cost compute nodes (servers). These are based on Intel and AMD motherboards but don’t be surprised if there is a shift to Atom in Open Compute soon enough.

This move towards the use of more energy efficient server chips, along with the sharing of server resources (storage, networking, management, power and cooling) across potentially thousands of servers is a significant shift away from the traditional server architecture.

It will fundamentally change the cost of deploying and operating large cloud infrastructures. It will also drastically increase the compute resources available online but the one thing it won’t do, as we know from Jevons’ Paradox, is it won’t reduce the amount of energy used in IT. Paradoxically, it may even increase it!

Photo credit HP

post

Friday Green Numbers round-up for July 8th 2011

Green Numbers

With the summer slowdown in travel, I’m re-instating the Friday Green Numbers Round-up – and so without further ado…

  1. Whitehall surpasses 10% CO2 reduction target

    Whitehall has surpassed its target of slashing its CO2 emissions by ten percent in one year, achieving a cut of almost 14 percent.

    Prime minister David Cameron said central government emissions have fallen by 13.8 percent in the past year, reducing energy bills by an estimated ?13 million.

    Topping the table was the Department for Education, which achieved a 21.5 percent cut, while the… Read on

  2. Britain’s richest man to build giant Arctic iron ore mine 300 miles inside Arctic Circle

    Lakshmi Mittal’s ‘mega-mine’ is believed to be the largest mineral extraction project in the region but threatens unique wildlife

    Britain’s richest man is planning a giant new opencast mine 300 miles inside the Arctic Circle in a bid to extract a potential $23bn (?14bn) worth of iron ore.

    The “mega-mine” ? which includes a 150km railway line and two new ports ? is believed to be the largest mineral extraction project in the Arctic and highlights the huge… Read on

  3. Amazon Resists Pressure To Disclose Data On Carbon Footprint

    Amazon revolutionized the retail industry in the United States, and for several years has had a strong presence in Europe and Asia. Its market cap among retailers lags only behind Walmart.

    Despite its successes, the e-commerce giant has attracted criticism for a perceived lack of transparency of its carbon footprint…. Read on

  4. Facebook in the top 10 most hated companies in America

    Business Insider posted an article titled ?The 19 Most Hated Companies In America.? The data was based on the American Customer Satisfaction Index (ACSI), which releases industry results monthly and updates its national index quarterly.

    Facebook was placed at number 10. I decided to take a look at just the 2010 data, which is the latest available if you want to see ratings from all the companies in the US…. Read on

  5. 7 ways cloud computing could be even greener

    Forrester Research is the latest organization to explore the link between cloud computing and green IT.

    Forrester notes that by its nature, cloud computing is more efficient. But here are seven ways that an IT professional can make his or her cloud computing even greener ? regardless of whether or not the approach is public or private:…. Read on

  6. E-On investing $600 million in Illinois wind farms

    Northwest of Kokomo, along U.S. 24 near the Indiana-Illinois state line, the horizon is broken by the sight of dozens of wind turbines slowly turning in the breeze.

    There, in the small town of Watseka, Ill., E-On Climate & Renewables is putting the finishing touches on the Settler’s Trail Wind Farm, and the company soon will start work on the Pioneer Trail Wind Farm in a neighboring portion of Iroquois County.

    E-On also plans to construct a major wind farm across parts of Howard, Tipton, Grant and Madison counties.

    Construction on Phase 1 of the Wildcat Wind Farm is…. Read on

  7. UK’s two biggest solar installations start generating energy

    A huge solar farm in Lincolnshire and another in Cornwall started generating green electricity on Thursday to become the UK’s two biggest solar installations, as developers rushed to beat an imminent cut in government subsidies.

    The 1MW Fen Farm solar park and the 1.4MW Wheal Jane park in Truro are two of several such large-scale projects rushing to connect to the grid. They are trying to benefit from a…. Read on

  8. Missing: 163 Million Women

    AMidway through his career, Christophe Guilmoto stopped counting babies and started counting boys. A French demographer with a mathematician’s love of numbers and an anthropologist’s obsession with detail, he had attended graduate school in Paris in the 1980s, when babies had been the thing.

    He did his dissertation research in Tamil Nadu.

    As it turned out, Tamil Nadu was in fact one of the states where girls had a better prospect of survival, while in 2001 the northwest, a wealthy region considered India’s breadbasket, reported a regional sex ratio at birth of 126?that is, 126 boys for every 100 girls. (The natural human sex ratio at birth is 105 boys for every 100 girls.) The cause for this gap, Guilmoto quickly learned, was that pregnant women were taking advantage of a cheap and pervasive sex determination tool?ultrasound?and aborting if the fetus turned out to be female… Read on

Photo credit Tom Raftery