
Photo credit Tom Raftery
I participated in last week’s IBM Global Eco Jam.
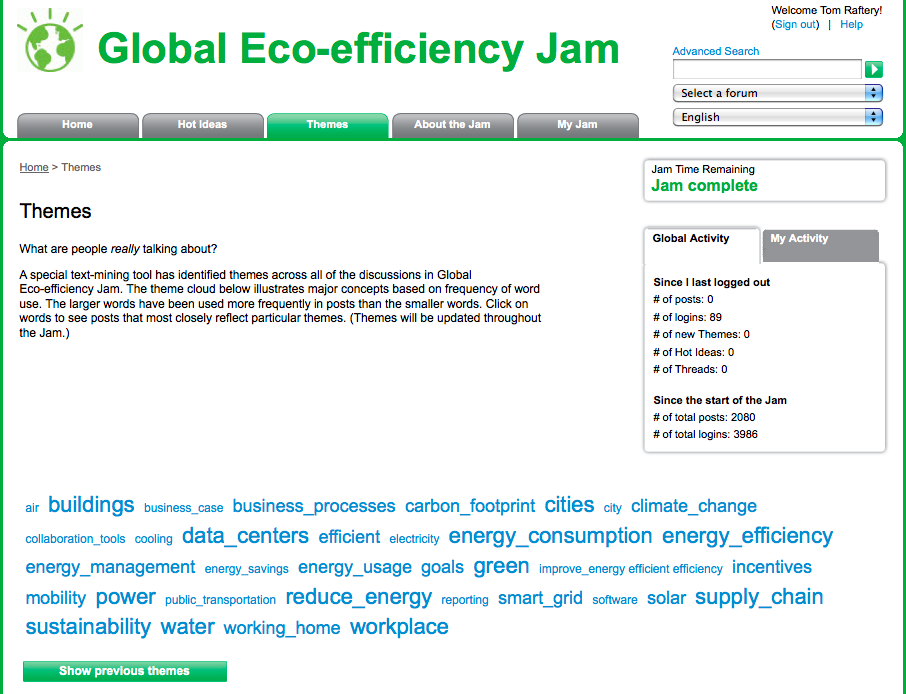
As you can see from above, the event generated 2080 posts from a total of 3987 logins.
I mentioned previously that the quality of the participants in the jam was really impressive, but what were attendees most interested in talking about during the jam?
The screenshot above is a tag cloud of the themes discussed during the jam. And while it gives some idea of the relative importance of topics explored during the jam, I decided to see if I could dig a little deeper into the numbers.
Doing a View Source of this page tells me the pixel size of each of the terms – see below:
12px – air
12px – business_case
12px – city
12px – collaboration_tools
12px – cooling
12px – electricity
12px – energy_savings
12px – improve_energy efficient efficiency
12px – public_transportation
12px – reporting
12px – software
18px – business_processes
18px – carbon_footprint
18px – climate_change
18px – efficient
18px – energy_management
18px – energy_usage
18px – goals
18px – incentives
18px – mobility
18px – smart_grid
18px – solar
18px – working_home
22px – buildings
22px – cities
22px – data_centers
22px – energy_consumption
22px – energy_efficiency
22px – green
22px – power
22px – reduce_energy
22px – supply_chain
22px – sustainability
22px – water
22px – workplace
Unfortunately they only seem to fall into three sizes – 12px, 18px and 22px – so not hugely granular, still it is something.
Clicking on the tags to see the posts doesn’t give an immediate indication of why some are larger than others unfortunately. All of the 22px tags contain 10 posts but so do the 18px and the 12px! Nor does it appear to refer to the number of replies to posts.
It is equally unclear how the tags were arrived at in the first place, apart from this explanation on the site – “A special text-mining tool has identified themes across all of the discussions in Global Eco-efficiency Jam. The theme cloud below illustrates major concepts based on frequency of word use”.
When creating a new post, or replying to previous posts there was no option to tag your responses.
35 posts were identified as being “Hot Ideas” – no idea how or why they were identified as such. It appears to have been a manual process. The hot ideas which generated the most responses (those with >30 replies) were, in decreasing order:
Getting Around – Mobility Services? – 79 replies
Cultural barriers to online collaboration – 58 replies
Greening Your Business Processes for Innovation – 47 replies
Green IT & Cloud Computing – 39 replies
Citizen engagement – 33 replies
Real world customer examples – 32 replies
IT’s Central Role In Managing Energy & Carbon – 32 replies
Integration to improve energy and eco-efficiency – 31 replies
Some of the Hot Ideas had as few as two responses, so the Hot Ideas designation doesn’t appear to come from response number!
Still, despite the lack of transparency around the process, it was an incredibly worthwhile event. I ended up contributing 45 posts (2% of the posts!) which received 46 responses. I learned loads and would definitely participate if IBM decide to hold another (hint, hint!).