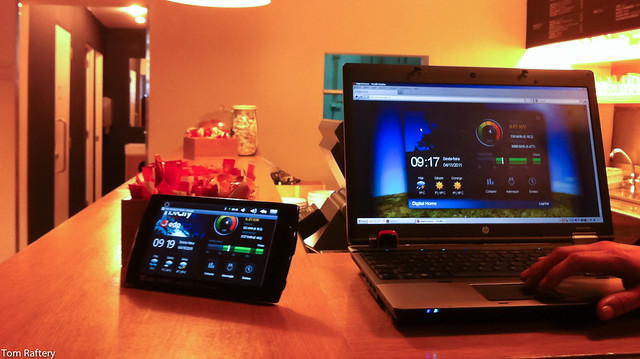
Logica brought me to the pretty Portuguese town of Évora recently to check out the InovGrid project which they have been participating in, along with EdP and other partner companies.
InovGrid is an ambitious project to roll out smart grid technologies to six million customers across Portugal. Évora’s InovCity is the first stage of the project. There are 35,000 people living in Évora, almost all of whom have been issued with smart meters by now.
The smart meters are connected in realtime to in-home displays (like the one pictured above) which takes energy consumption readings every two seconds and plots it on the screen. It can display the usage data as kWh, CO2 or more tangibly, the € cost. If the home or business has an internet connection, this information can be viewed remotely on a computer or mobile device (as seen on the laptop on the right in the image above). Interestingly, there is two-way communication going on here, so if smart plugs are installed in the house, they can be controlled (on/off) from the in-home display, or remotely.
The information displayed on the in-home displays, and remotely, is not the same information which is sent to the utility for billing purposes. This may lead to some discrepancies in the € amount on the displays versus the amount on the bill at the end of the month. The smart meters send billing information to the utilities over Power Line Communications (with a GPRS backup). Even with the PLC connection, there is far too much data in 2 second reads, so a lower rate of reads is sent to the utility for billing purposes.
Interestingly, the in-home device shown above was installed in a coffee shop in Évora and it was possible to watch the fluctuations in the consumption graph in realtime as coffee was being made for customers. Also, the coffee shop realised €500 savings per annum in their energy bill when they examined the information from the device and realised they were not on the optimal tariff. It also demonstrated to them the savings to be had from turning off the coffee machine overnight, so the extra information from the device helped influence their behaviour.
Other than the smart meters, we were shown the information display in the town hall, which shows the realtime energy consumption of the building. This information is also supposed to be available on the town hall’s website for citizens to see remotely, though I failed to find it there (doubtless due to my lack of Portuguese!).
Other nice features on display were dedicated parking places for electric vehicles (EV’s), complete with charging stations as well as LED streetlights with motion sensors which dim the lights in the absence of people on the streets. The EV parking place was predictably empty due more to the general unavailability of EV’s than anything else. The LED streetlights though was interesting. Very few towns or cities have, as yet, embraced LED streetlights and yet 50% of a town’s energy spend can be on streetlights. LED lights can save 80-90% of the energy cost over traditional streetlights, they can report back their status (obviating the need to have staff checking for lighting failures) and they have a much longer lifetime, so they save on maintenance costs as well as energy.
It would be interesting to hear back from the InovCity people how much Évora is saving on lighting costs from the move to LED (even if only the energy savings) but even more interesting would be to try to see if the rollout of the smart meters and in-home displays has led to any sustained, per home, energy consumption reduction.
One last comment on this project – I can’t help but feel that the provision of in-home displays is an idea whose time has past. These days most people have access to a tablet, a smartphone or a computer where they can access this information. I suspect as the InovGrid project rolls out beyond the 35,000 inhabitants of Évora to rest of Portugal, the IHD’s will become at best, an added extra option, or quietly killed off.
Photo credits Tom Raftery


